Pima Disability
COMPARE
Pima
Select to Compare
Disability
Pima Disability
13.7%
DISABILITY
0.0/ 100
METRIC RATING
316th/ 347
METRIC RANK
Pima Disability Correlation Chart
The statistical analysis conducted on geographies consisting of 61,542,416 people shows a moderate positive correlation between the proportion of Pima and percentage of population with a disability in the United States with a correlation coefficient (R) of 0.421 and weighted average of 13.7%. On average, for every 1% (one percent) increase in Pima within a typical geography, there is an increase of 0.057% in percentage of population with a disability.
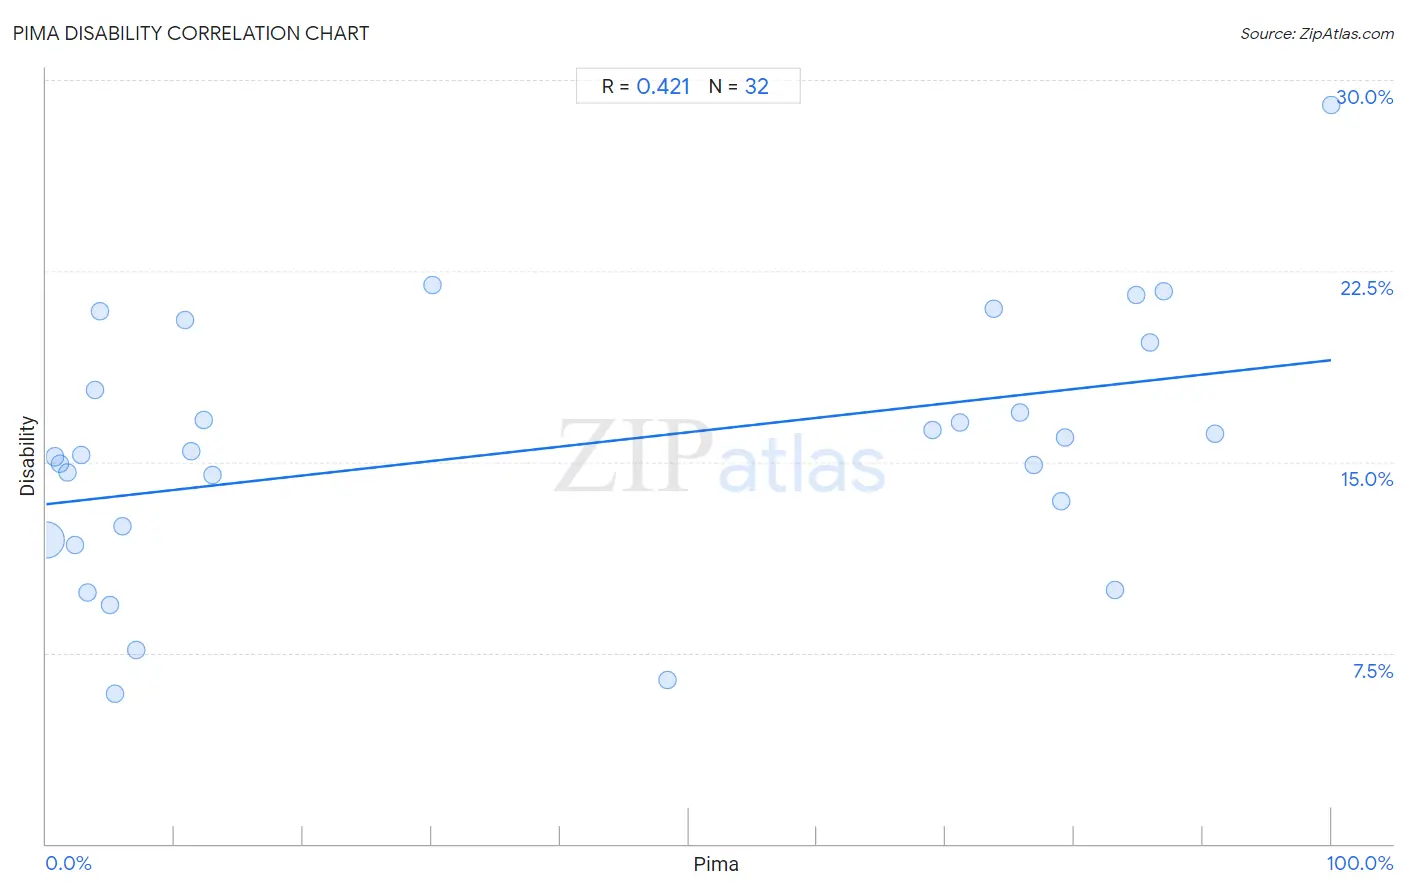
It is essential to understand that the correlation between the percentage of Pima and percentage of population with a disability does not imply a direct cause-and-effect relationship. It remains uncertain whether the presence of Pima influences an upward or downward trend in the level of percentage of population with a disability within an area, or if Pima simply ended up residing in those areas with higher or lower levels of percentage of population with a disability due to other factors.
Demographics Similar to Pima by Disability
In terms of disability, the demographic groups most similar to Pima are Immigrants from Cabo Verde (13.7%, a difference of 0.0%), Black/African American (13.7%, a difference of 0.030%), Puget Sound Salish (13.7%, a difference of 0.030%), Cree (13.7%, a difference of 0.070%), and Spanish American (13.6%, a difference of 0.42%).
| Demographics | Rating | Rank | Disability |
| Tlingit-Haida | 0.0 /100 | #309 | Tragic 13.5% |
| Blackfeet | 0.0 /100 | #310 | Tragic 13.6% |
| Delaware | 0.0 /100 | #311 | Tragic 13.6% |
| Spanish Americans | 0.0 /100 | #312 | Tragic 13.6% |
| Cree | 0.0 /100 | #313 | Tragic 13.7% |
| Blacks/African Americans | 0.0 /100 | #314 | Tragic 13.7% |
| Puget Sound Salish | 0.0 /100 | #315 | Tragic 13.7% |
| Pima | 0.0 /100 | #316 | Tragic 13.7% |
| Immigrants from Cabo Verde | 0.0 /100 | #317 | Tragic 13.7% |
| Menominee | 0.0 /100 | #318 | Tragic 13.8% |
| Iroquois | 0.0 /100 | #319 | Tragic 13.8% |
| Apache | 0.0 /100 | #320 | Tragic 13.9% |
| Paiute | 0.0 /100 | #321 | Tragic 13.9% |
| Americans | 0.0 /100 | #322 | Tragic 13.9% |
| Comanche | 0.0 /100 | #323 | Tragic 14.1% |
Pima Disability Correlation Summary
| Measurement | Pima Data | Disability Data |
| Minimum | 0.038% | 5.9% |
| Maximum | 100.0% | 29.0% |
| Range | 100.0% | 23.1% |
| Mean | 38.3% | 15.5% |
| Median | 12.6% | 15.3% |
| Interquartile 25% (IQ1) | 4.0% | 12.2% |
| Interquartile 75% (IQ3) | 77.9% | 18.7% |
| Interquartile Range (IQR) | 73.9% | 6.5% |
| Standard Deviation (Sample) | 37.6% | 5.1% |
| Standard Deviation (Population) | 37.0% | 5.0% |
Correlation Details
| Pima Percentile | Sample Size | Disability |
[ 0.0% - 0.5% ] 0.038% | 60,538,176 | 11.9% |
[ 0.5% - 1.0% ] 0.71% | 540,838 | 15.2% |
[ 1.0% - 1.5% ] 1.10% | 224,372 | 14.9% |
[ 1.5% - 2.0% ] 1.66% | 66,702 | 14.6% |
[ 2.0% - 2.5% ] 2.23% | 53,054 | 11.7% |
[ 2.5% - 3.0% ] 2.76% | 5,078 | 15.3% |
[ 3.0% - 3.5% ] 3.20% | 7,278 | 9.9% |
[ 3.5% - 4.0% ] 3.77% | 3,426 | 17.8% |
[ 4.0% - 4.5% ] 4.15% | 5,836 | 20.9% |
[ 4.5% - 5.0% ] 4.99% | 51,156 | 9.4% |
[ 5.0% - 5.5% ] 5.32% | 1,371 | 5.9% |
[ 5.5% - 6.0% ] 5.92% | 2,027 | 12.5% |
[ 7.0% - 7.5% ] 7.01% | 1,370 | 7.6% |
[ 10.5% - 11.0% ] 10.78% | 102 | 20.6% |
[ 11.0% - 11.5% ] 11.29% | 17,830 | 15.4% |
[ 12.0% - 12.5% ] 12.28% | 1,270 | 16.6% |
[ 12.5% - 13.0% ] 12.92% | 387 | 14.5% |
[ 30.0% - 30.5% ] 30.03% | 383 | 21.9% |
[ 48.0% - 48.5% ] 48.39% | 965 | 6.4% |
[ 68.5% - 69.0% ] 68.98% | 332 | 16.3% |
[ 71.0% - 71.5% ] 71.13% | 478 | 16.5% |
[ 73.5% - 74.0% ] 73.77% | 385 | 21.0% |
[ 75.5% - 76.0% ] 75.80% | 1,835 | 16.9% |
[ 76.5% - 77.0% ] 76.81% | 470 | 14.9% |
[ 78.5% - 79.0% ] 78.99% | 2,713 | 13.5% |
[ 79.0% - 79.5% ] 79.26% | 4,538 | 15.9% |
[ 83.0% - 83.5% ] 83.14% | 4,139 | 9.9% |
[ 84.5% - 85.0% ] 84.86% | 733 | 21.6% |
[ 85.5% - 86.0% ] 85.85% | 615 | 19.7% |
[ 86.5% - 87.0% ] 86.98% | 3,265 | 21.7% |
[ 90.5% - 91.0% ] 90.94% | 806 | 16.1% |
[ 99.5% - 100.0% ] 100.00% | 486 | 29.0% |