Pima Wage/Income Gap

COMPARE

Pima
Race
Ancestry
AfghanAfricanAlaska NativeAlaskan AthabascanAlbanianAleutAlsatianAmericanApacheArabArapahoArgentineanArmenianAssyrian/Chaldean/SyriacAustralianAustrianBahamianBangladeshiBarbadianBasqueBelgianBelizeanBermudanBhutaneseBlackfeetBolivianBrazilianBritishBritish West IndianBulgarianBurmeseCajunCambodianCanadianCape VerdeanCarpatho RusynCelticCentral AmericanCentral American IndianCherokeeCheyenneChickasawChileanChineseChippewaChoctawColombianColvilleComancheCosta RicanCreeCreekCroatianCrowCubanCypriotCzechCzechoslovakianDanishDelawareDominicanDutchDutch West IndianEastern EuropeanEcuadorianEgyptianEnglishEstonianEthiopianEuropeanFijianFilipinoFinnishFrenchFrench American IndianFrench CanadianGermanGerman RussianGhanaianGreekGuamanian/ChamorroGuatemalanGuyaneseHaitianHmongHonduranHopiHoumaHungarianIcelanderIndian (Asian)IndonesianInupiatIranianIraqiIrishIroquoisIsraeliItalianJamaicanJapaneseJordanianKenyanKiowaKoreanLaotianLatvianLebaneseLiberianLithuanianLumbeeLuxembourgerMacedonianMalaysianMalteseMarshalleseMenomineeMexicanMexican American IndianMongolianMoroccanNative HawaiianNavajoNepaleseNew ZealanderNicaraguanNigerianNorthern EuropeanNorwegianOkinawanOsageOttawaPaiutePakistaniPalestinianPanamanianParaguayanPennsylvania GermanPeruvianPimaPolishPortuguesePotawatomiPuebloPuerto RicanPuget Sound SalishRomanianRussianSalvadoranSamoanScandinavianScotch-IrishScottishSeminoleSenegaleseSerbianShoshoneSierra LeoneanSiouxSlavicSlovakSloveneSomaliSouth AfricanSouth AmericanSouth American IndianSoviet UnionSpaniardSpanishSpanish AmericanSpanish American IndianSri LankanSubsaharan AfricanSudaneseSwedishSwissSyrianTaiwaneseThaiTlingit-HaidaTohono O'OdhamTonganTrinidadian and TobagonianTsimshianTurkishU.S. Virgin IslanderUgandanUkrainianUruguayanUteVenezuelanVietnameseWelshWest IndianYakamaYaquiYugoslavianYumanYup'ikZimbabwean
Immigration
NonimmigrantsImmigrantsAfghanistanAfricaAlbaniaArgentinaArmeniaAsiaAustraliaAustriaBahamasBangladeshBarbadosBelarusBelgiumBelizeBoliviaBosnia and HerzegovinaBrazilBulgariaBurma/MyanmarCabo VerdeCambodiaCameroonCanadaCaribbeanCentral AmericaChileChinaColombiaCongoCosta RicaCroatiaCubaCzechoslovakiaDenmarkDominicaDominican RepublicEastern AfricaEastern AsiaEastern EuropeEcuadorEgyptEl SalvadorEnglandEritreaEthiopiaEuropeFijiFranceGermanyGhanaGreeceGrenadaGuatemalaGuyanaHaitiHondurasHong KongHungaryIndiaIndonesiaIranIraqIrelandIsraelItalyJamaicaJapanJordanKazakhstanKenyaKoreaKuwaitLaosLatin AmericaLatviaLebanonLiberiaLithuaniaMalaysiaMexicoMicronesiaMiddle AfricaMoldovaMoroccoNepalNetherlandsNicaraguaNigeriaNorth AmericaNorth MacedoniaNorthern AfricaNorthern EuropeNorwayOceaniaPakistanPanamaPeruPhilippinesPolandPortugalRomaniaRussiaSaudi ArabiaScotlandSenegalSerbiaSierra LeoneSingaporeSomaliaSouth AfricaSouth AmericaSouth Central AsiaSouth Eastern AsiaSouthern EuropeSpainSri LankaSt. Vincent and the GrenadinesSudanSwedenSwitzerlandSyriaTaiwanThailandTrinidad and TobagoTurkeyUgandaUkraineUruguayUzbekistanVenezuelaVietnamWest IndiesWestern AfricaWestern AsiaWestern EuropeYemenZaireZimbabweAzores
Select to Compare
Race
Ancestry
AfghanAfricanAlaska NativeAlaskan AthabascanAlbanianAleutAlsatianAmericanApacheArabArapahoArgentineanArmenianAssyrian/Chaldean/SyriacAustralianAustrianBahamianBangladeshiBarbadianBasqueBelgianBelizeanBermudanBhutaneseBlackfeetBolivianBrazilianBritishBritish West IndianBulgarianBurmeseCajunCambodianCanadianCape VerdeanCarpatho RusynCelticCentral AmericanCentral American IndianCherokeeCheyenneChickasawChileanChineseChippewaChoctawColombianColvilleComancheCosta RicanCreeCreekCroatianCrowCubanCypriotCzechCzechoslovakianDanishDelawareDominicanDutchDutch West IndianEastern EuropeanEcuadorianEgyptianEnglishEstonianEthiopianEuropeanFijianFilipinoFinnishFrenchFrench American IndianFrench CanadianGermanGerman RussianGhanaianGreekGuamanian/ChamorroGuatemalanGuyaneseHaitianHmongHonduranHopiHoumaHungarianIcelanderIndian (Asian)IndonesianInupiatIranianIraqiIrishIroquoisIsraeliItalianJamaicanJapaneseJordanianKenyanKiowaKoreanLaotianLatvianLebaneseLiberianLithuanianLumbeeLuxembourgerMacedonianMalaysianMalteseMarshalleseMenomineeMexicanMexican American IndianMongolianMoroccanNative HawaiianNavajoNepaleseNew ZealanderNicaraguanNigerianNorthern EuropeanNorwegianOkinawanOsageOttawaPaiutePakistaniPalestinianPanamanianParaguayanPennsylvania GermanPeruvianPolishPortuguesePotawatomiPuebloPuerto RicanPuget Sound SalishRomanianRussianSalvadoranSamoanScandinavianScotch-IrishScottishSeminoleSenegaleseSerbianShoshoneSierra LeoneanSiouxSlavicSlovakSloveneSomaliSouth AfricanSouth AmericanSouth American IndianSoviet UnionSpaniardSpanishSpanish AmericanSpanish American IndianSri LankanSubsaharan AfricanSudaneseSwedishSwissSyrianTaiwaneseThaiTlingit-HaidaTohono O'OdhamTonganTrinidadian and TobagonianTsimshianTurkishU.S. Virgin IslanderUgandanUkrainianUruguayanUteVenezuelanVietnameseWelshWest IndianYakamaYaquiYugoslavianYumanYup'ikZimbabwean
Immigration
NonimmigrantsImmigrantsAfghanistanAfricaAlbaniaArgentinaArmeniaAsiaAustraliaAustriaBahamasBangladeshBarbadosBelarusBelgiumBelizeBoliviaBosnia and HerzegovinaBrazilBulgariaBurma/MyanmarCabo VerdeCambodiaCameroonCanadaCaribbeanCentral AmericaChileChinaColombiaCongoCosta RicaCroatiaCubaCzechoslovakiaDenmarkDominicaDominican RepublicEastern AfricaEastern AsiaEastern EuropeEcuadorEgyptEl SalvadorEnglandEritreaEthiopiaEuropeFijiFranceGermanyGhanaGreeceGrenadaGuatemalaGuyanaHaitiHondurasHong KongHungaryIndiaIndonesiaIranIraqIrelandIsraelItalyJamaicaJapanJordanKazakhstanKenyaKoreaKuwaitLaosLatin AmericaLatviaLebanonLiberiaLithuaniaMalaysiaMexicoMicronesiaMiddle AfricaMoldovaMoroccoNepalNetherlandsNicaraguaNigeriaNorth AmericaNorth MacedoniaNorthern AfricaNorthern EuropeNorwayOceaniaPakistanPanamaPeruPhilippinesPolandPortugalRomaniaRussiaSaudi ArabiaScotlandSenegalSerbiaSierra LeoneSingaporeSomaliaSouth AfricaSouth AmericaSouth Central AsiaSouth Eastern AsiaSouthern EuropeSpainSri LankaSt. Vincent and the GrenadinesSudanSwedenSwitzerlandSyriaTaiwanThailandTrinidad and TobagoTurkeyUgandaUkraineUruguayUzbekistanVenezuelaVietnamWest IndiesWestern AfricaWestern AsiaWestern EuropeYemenZaireZimbabweAzores
Wage/Income Gap
Income
Poverty
Unemployment
Labor Participation
Family Structure
Vehicle Availability
Education Level
Disability

Pima Wage/Income Gap
Exceptional

21.1%
WAGE/INCOME GAP
100.0/ 100
METRIC RATING
34th/ 347
METRIC RANK

Pima Wage/Income Gap Correlation Chart

The statistical analysis conducted on geographies consisting of 61,509,383 people shows a mild negative correlation between the proportion of Pima and wage/income gap percentage in the United States with a correlation coefficient (R) of -0.353 and weighted average of 21.1%. On average, for every 1% (one percent) increase in Pima within a typical geography, there is a decrease of 0.085% in wage/income gap percentage.
Pima Wage/Income Gap
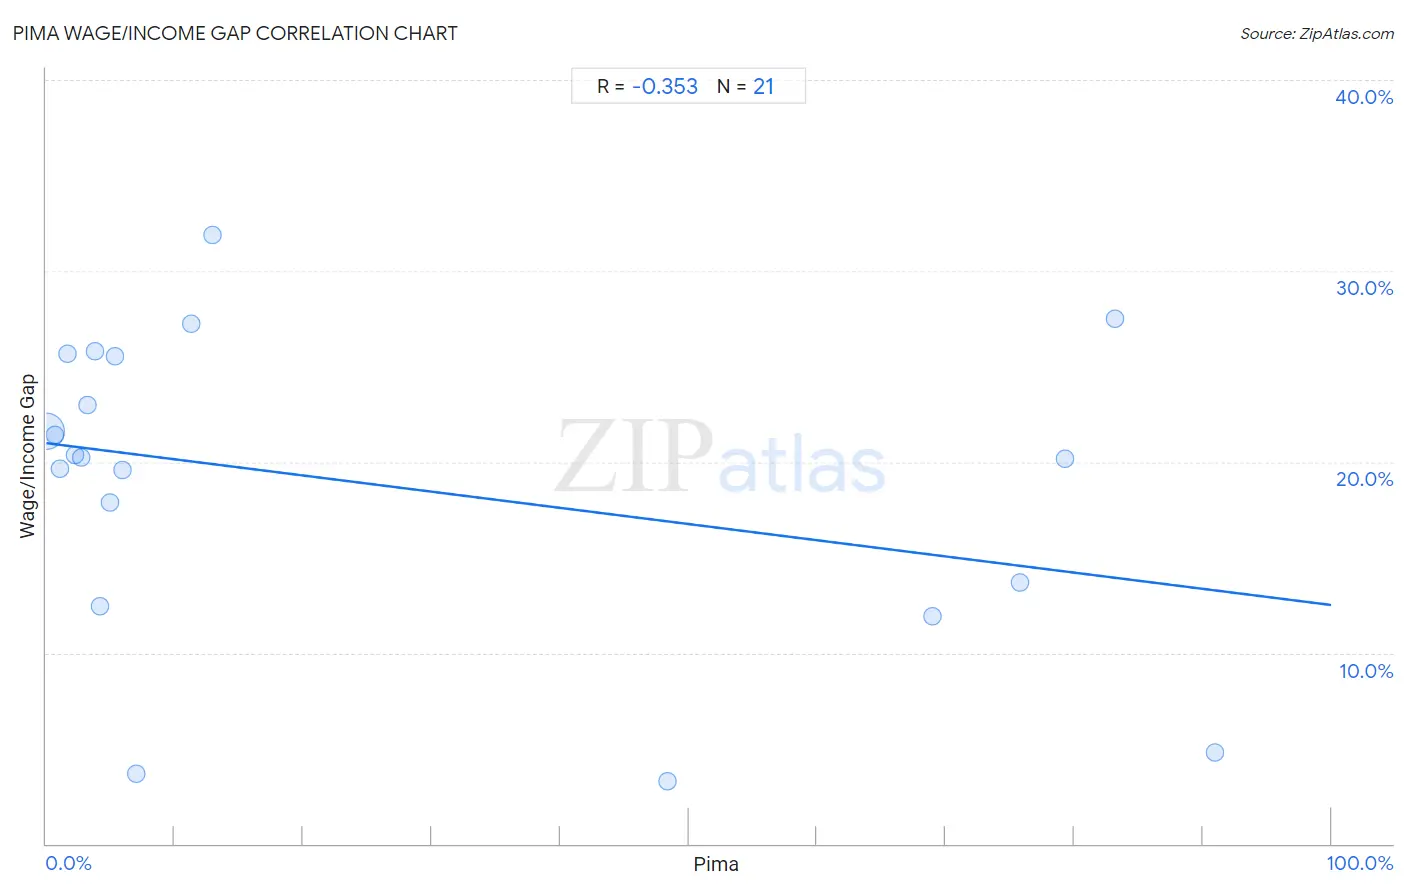
It is essential to understand that the correlation between the percentage of Pima and wage/income gap percentage does not imply a direct cause-and-effect relationship. It remains uncertain whether the presence of Pima influences an upward or downward trend in the level of wage/income gap percentage within an area, or if Pima simply ended up residing in those areas with higher or lower levels of wage/income gap percentage due to other factors.

Demographics Similar to Pima by Wage/Income Gap

In terms of wage/income gap, the demographic groups most similar to Pima are Immigrants from Bahamas (21.1%, a difference of 0.28%), Immigrants from Yemen (21.1%, a difference of 0.30%), Vietnamese (21.0%, a difference of 0.53%), Somali (21.2%, a difference of 0.55%), and Belizean (21.2%, a difference of 0.57%).
DemographicsRating | RankWage/Income Gap
Immigrants from Armenia
100.0
/100
|
#27
Exceptional
20.7%
Inupiat
100.0
/100
|
#28
Exceptional
20.8%
Immigrants from Senegal
100.0
/100
|
#29
Exceptional
20.9%
Immigrants from Bangladesh
100.0
/100
|
#30
Exceptional
20.9%
Vietnamese
100.0
/100
|
#31
Exceptional
21.0%
Immigrants from Yemen
100.0
/100
|
#32
Exceptional
21.1%
Immigrants from Bahamas
100.0
/100
|
#33
Exceptional
21.1%
Pima
100.0
/100
|
#34
Exceptional
21.1%
Somalis
100.0
/100
|
#35
Exceptional
21.2%
Belizeans
100.0
/100
|
#36
Exceptional
21.2%
Immigrants from Somalia
100.0
/100
|
#37
Exceptional
21.2%
Immigrants from Belize
100.0
/100
|
#38
Exceptional
21.3%
Colville
100.0
/100
|
#39
Exceptional
21.3%
Lumbee
100.0
/100
|
#40
Exceptional
21.3%
Liberians
100.0
/100
|
#41
Exceptional
21.4%

Pima Wage/Income Gap Correlation Summary

MeasurementPima DataWage/Income Gap Data
Minimum0.038%3.3%
Maximum90.9%31.9%
Range90.9%28.6%
Mean24.5%18.9%
Median5.3%20.2%
Interquartile 25% (IQ1)2.5%13.1%
Interquartile 75% (IQ3)58.7%25.6%
Interquartile Range (IQR)56.2%12.5%
Standard Deviation (Sample)33.3%8.0%
Standard Deviation (Population)32.5%7.8%

Correlation Details

Pima PercentileSample SizeWage/Income Gap
[
0.0%
-
0.5%
]
0.038%
60,525,23821.6%
[
0.5%
-
1.0%
]
0.71%
535,67621.4%
[
1.0%
-
1.5%
]
1.10%
221,88219.6%
[
1.5%
-
2.0%
]
1.66%
66,70225.6%
[
2.0%
-
2.5%
]
2.23%
53,05420.3%
[
2.5%
-
3.0%
]
2.76%
5,07820.2%
[
3.0%
-
3.5%
]
3.20%
5,90623.0%
[
3.5%
-
4.0%
]
3.77%
3,42625.8%
[
4.0%
-
4.5%
]
4.15%
5,83612.5%
[
4.5%
-
5.0%
]
4.99%
51,15617.8%
[
5.0%
-
5.5%
]
5.32%
1,37125.5%
[
5.5%
-
6.0%
]
5.92%
2,02719.6%
[
7.0%
-
7.5%
]
7.01%
1,3703.7%
[
11.0%
-
11.5%
]
11.29%
17,65927.2%
[
12.5%
-
13.0%
]
12.92%
38731.9%
[
48.0%
-
48.5%
]
48.39%
9653.3%
[
68.5%
-
69.0%
]
68.98%
33211.9%
[
75.5%
-
76.0%
]
75.80%
1,83513.7%
[
79.0%
-
79.5%
]
79.26%
4,53820.2%
[
83.0%
-
83.5%
]
83.14%
4,13927.5%
[
90.5%
-
91.0%
]
90.94%
8064.8%