Immigrants from Venezuela 4 or more Vehicles in Household
COMPARE
Immigrants from Venezuela
Select to Compare
4 or more Vehicles in Household
Immigrants from Venezuela 4 or more Vehicles in Household
5.2%
4+ VEHICLES AVAILABLE
0.1/ 100
METRIC RATING
297th/ 347
METRIC RANK
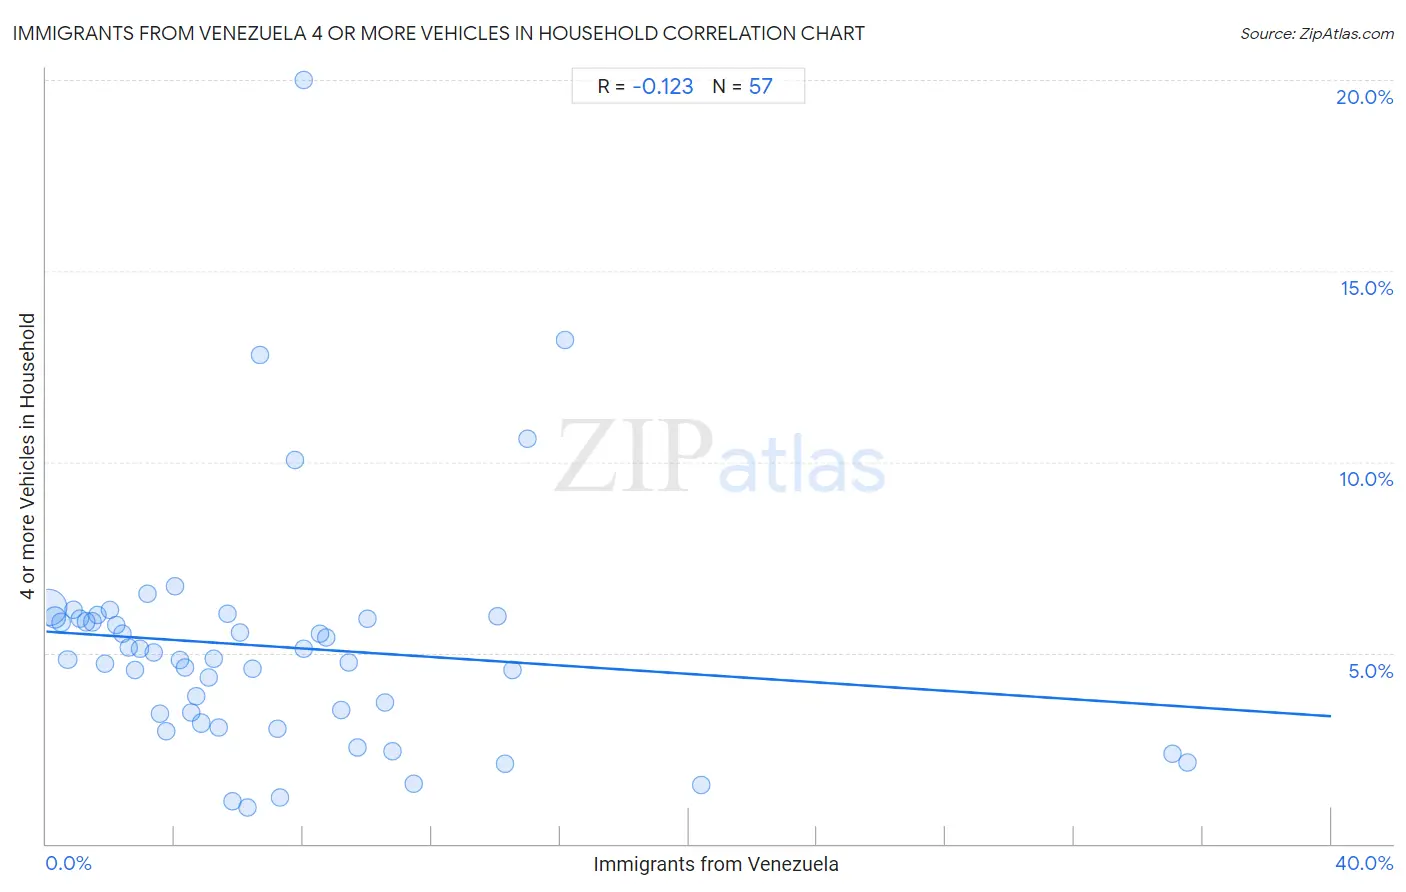
Immigrants from Venezuela 4 or more Vehicles in Household Correlation Chart
The statistical analysis conducted on geographies consisting of 286,483,857 people shows a poor negative correlation between the proportion of Immigrants from Venezuela and percentage of households with 4 or more vehicles available in the United States with a correlation coefficient (R) of -0.123 and weighted average of 5.2%. On average, for every 1% (one percent) increase in Immigrants from Venezuela within a typical geography, there is a decrease of 0.056% in percentage of households with 4 or more vehicles available.
It is essential to understand that the correlation between the percentage of Immigrants from Venezuela and percentage of households with 4 or more vehicles available does not imply a direct cause-and-effect relationship. It remains uncertain whether the presence of Immigrants from Venezuela influences an upward or downward trend in the level of percentage of households with 4 or more vehicles available within an area, or if Immigrants from Venezuela simply ended up residing in those areas with higher or lower levels of percentage of households with 4 or more vehicles available due to other factors.
Demographics Similar to Immigrants from Venezuela by 4 or more Vehicles in Household
In terms of 4 or more vehicles in household, the demographic groups most similar to Immigrants from Venezuela are Israeli (5.2%, a difference of 0.29%), Immigrants from South America (5.2%, a difference of 0.34%), Immigrants from Brazil (5.2%, a difference of 0.47%), Ghanaian (5.2%, a difference of 0.58%), and Immigrants from Congo (5.2%, a difference of 0.64%).
| Demographics | Rating | Rank | 4 or more Vehicles in Household |
| Immigrants from Russia | 0.2 /100 | #290 | Tragic 5.3% |
| Immigrants from Bahamas | 0.1 /100 | #291 | Tragic 5.3% |
| Liberians | 0.1 /100 | #292 | Tragic 5.3% |
| Immigrants from Congo | 0.1 /100 | #293 | Tragic 5.2% |
| Ghanaians | 0.1 /100 | #294 | Tragic 5.2% |
| Immigrants from Brazil | 0.1 /100 | #295 | Tragic 5.2% |
| Israelis | 0.1 /100 | #296 | Tragic 5.2% |
| Immigrants from Venezuela | 0.1 /100 | #297 | Tragic 5.2% |
| Immigrants from South America | 0.1 /100 | #298 | Tragic 5.2% |
| Immigrants from Ghana | 0.1 /100 | #299 | Tragic 5.2% |
| Immigrants from Morocco | 0.0 /100 | #300 | Tragic 5.1% |
| Immigrants from Zaire | 0.0 /100 | #301 | Tragic 5.1% |
| Bahamians | 0.0 /100 | #302 | Tragic 5.1% |
| Immigrants from Greece | 0.0 /100 | #303 | Tragic 5.1% |
| Cypriots | 0.0 /100 | #304 | Tragic 5.0% |
Immigrants from Venezuela 4 or more Vehicles in Household Correlation Summary
| Measurement | Immigrants from Venezuela Data | 4 or more Vehicles in Household Data |
| Minimum | 0.077% | 0.94% |
| Maximum | 35.5% | 20.0% |
| Range | 35.5% | 19.1% |
| Mean | 7.2% | 5.2% |
| Median | 5.4% | 4.9% |
| Interquartile 25% (IQ1) | 2.7% | 3.3% |
| Interquartile 75% (IQ3) | 9.3% | 5.9% |
| Interquartile Range (IQR) | 6.6% | 2.6% |
| Standard Deviation (Sample) | 7.0% | 3.2% |
| Standard Deviation (Population) | 7.0% | 3.1% |
Correlation Details
| Immigrants from Venezuela Percentile | Sample Size | 4 or more Vehicles in Household |
[ 0.0% - 0.5% ] 0.077% | 198,044,741 | 6.2% |
[ 0.0% - 0.5% ] 0.27% | 40,305,016 | 5.9% |
[ 0.0% - 0.5% ] 0.46% | 16,310,340 | 5.8% |
[ 0.5% - 1.0% ] 0.67% | 9,329,455 | 4.8% |
[ 0.5% - 1.0% ] 0.85% | 4,906,975 | 6.1% |
[ 1.0% - 1.5% ] 1.03% | 2,687,024 | 5.9% |
[ 1.0% - 1.5% ] 1.24% | 2,616,020 | 5.8% |
[ 1.0% - 1.5% ] 1.43% | 1,735,608 | 5.8% |
[ 1.5% - 2.0% ] 1.61% | 1,064,188 | 6.0% |
[ 1.5% - 2.0% ] 1.84% | 693,979 | 4.7% |
[ 1.5% - 2.0% ] 2.00% | 1,546,947 | 6.1% |
[ 2.0% - 2.5% ] 2.18% | 302,898 | 5.7% |
[ 2.0% - 2.5% ] 2.36% | 745,574 | 5.5% |
[ 2.5% - 3.0% ] 2.56% | 529,146 | 5.1% |
[ 2.5% - 3.0% ] 2.77% | 318,933 | 4.6% |
[ 2.5% - 3.0% ] 2.94% | 250,754 | 5.1% |
[ 3.0% - 3.5% ] 3.14% | 366,398 | 6.6% |
[ 3.0% - 3.5% ] 3.33% | 430,339 | 5.0% |
[ 3.5% - 4.0% ] 3.55% | 655,448 | 3.4% |
[ 3.5% - 4.0% ] 3.72% | 594,852 | 2.9% |
[ 3.5% - 4.0% ] 3.99% | 96,877 | 6.8% |
[ 4.0% - 4.5% ] 4.15% | 434,328 | 4.8% |
[ 4.0% - 4.5% ] 4.30% | 344,578 | 4.6% |
[ 4.5% - 5.0% ] 4.52% | 196,179 | 3.4% |
[ 4.5% - 5.0% ] 4.68% | 133,624 | 3.9% |
[ 4.5% - 5.0% ] 4.82% | 240,211 | 3.2% |
[ 5.0% - 5.5% ] 5.05% | 119,732 | 4.4% |
[ 5.0% - 5.5% ] 5.22% | 50,797 | 4.9% |
[ 5.0% - 5.5% ] 5.36% | 95,081 | 3.1% |
[ 5.5% - 6.0% ] 5.65% | 146,976 | 6.0% |
[ 5.5% - 6.0% ] 5.81% | 15,184 | 1.1% |
[ 6.0% - 6.5% ] 6.02% | 240,424 | 5.5% |
[ 6.0% - 6.5% ] 6.26% | 22,202 | 0.94% |
[ 6.0% - 6.5% ] 6.41% | 79,823 | 4.6% |
[ 6.5% - 7.0% ] 6.65% | 25,418 | 12.8% |
[ 7.0% - 7.5% ] 7.19% | 56,589 | 3.0% |
[ 7.0% - 7.5% ] 7.27% | 25,283 | 1.2% |
[ 7.5% - 8.0% ] 7.76% | 4,975 | 10.0% |
[ 8.0% - 8.5% ] 8.00% | 19,895 | 5.1% |
[ 8.0% - 8.5% ] 8.02% | 212 | 20.0% |
[ 8.5% - 9.0% ] 8.53% | 48,808 | 5.5% |
[ 8.5% - 9.0% ] 8.73% | 51,142 | 5.4% |
[ 9.0% - 9.5% ] 9.16% | 14,557 | 3.5% |
[ 9.0% - 9.5% ] 9.43% | 2,419 | 4.7% |
[ 9.5% - 10.0% ] 9.70% | 78,478 | 2.5% |
[ 10.0% - 10.5% ] 10.01% | 23,734 | 5.9% |
[ 10.5% - 11.0% ] 10.53% | 66,299 | 3.7% |
[ 10.5% - 11.0% ] 10.78% | 57,150 | 2.4% |
[ 11.0% - 11.5% ] 11.46% | 20,034 | 1.6% |
[ 14.0% - 14.5% ] 14.06% | 68,029 | 5.9% |
[ 14.0% - 14.5% ] 14.26% | 54,464 | 2.1% |
[ 14.5% - 15.0% ] 14.53% | 57,878 | 4.6% |
[ 14.5% - 15.0% ] 14.96% | 548 | 10.6% |
[ 16.0% - 16.5% ] 16.13% | 11,809 | 13.2% |
[ 20.0% - 20.5% ] 20.40% | 5,843 | 1.5% |
[ 35.0% - 35.5% ] 35.06% | 64,751 | 2.4% |
[ 35.5% - 36.0% ] 35.53% | 74,891 | 2.1% |