Immigrants from Russia 4 or more Vehicles in Household
COMPARE
Immigrants from Russia
Select to Compare
4 or more Vehicles in Household
Immigrants from Russia 4 or more Vehicles in Household
5.3%
4+ VEHICLES AVAILABLE
0.2/ 100
METRIC RATING
290th/ 347
METRIC RANK
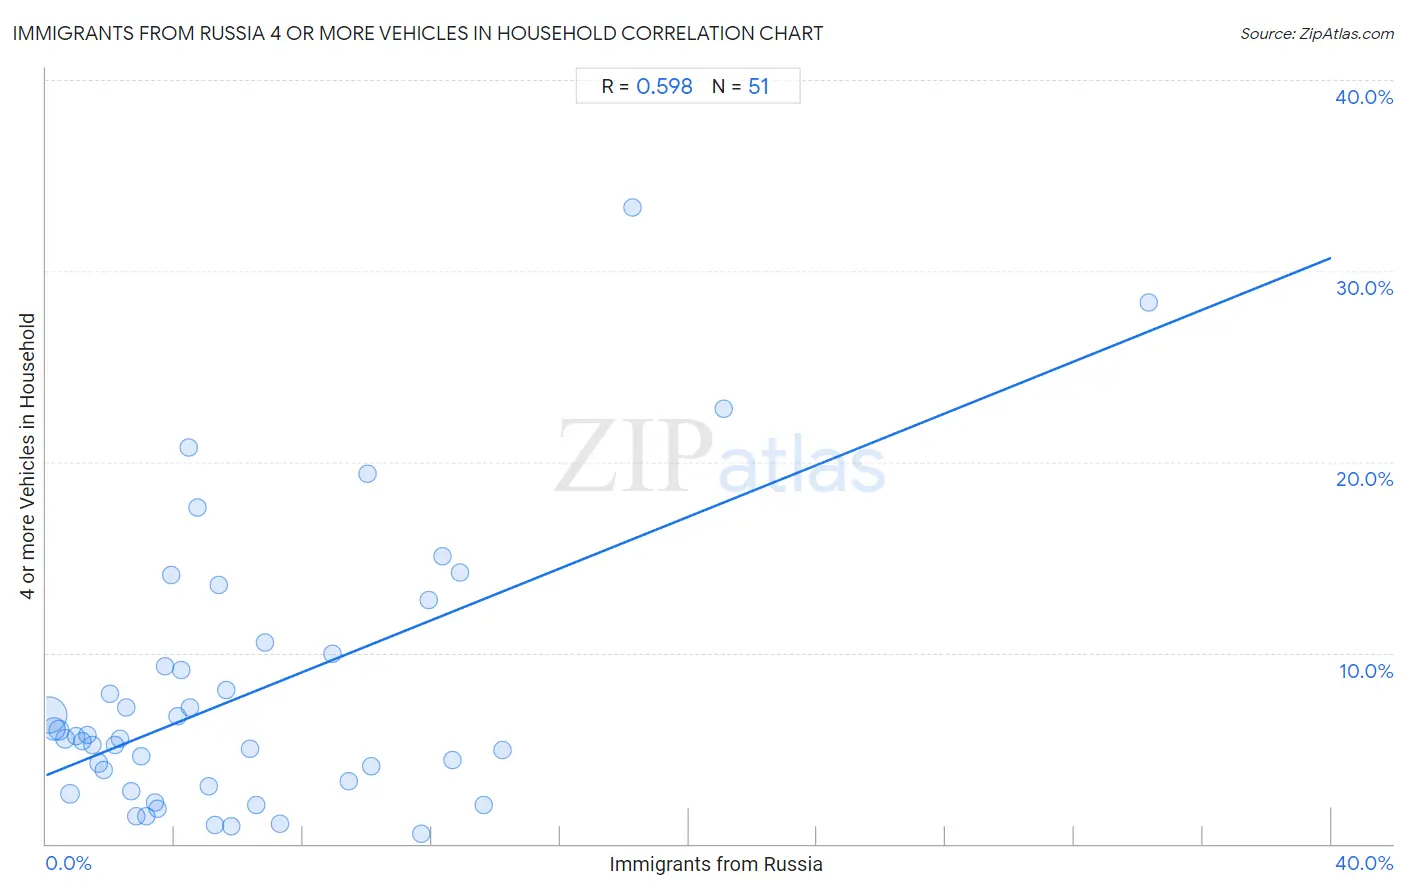
Immigrants from Russia 4 or more Vehicles in Household Correlation Chart
The statistical analysis conducted on geographies consisting of 346,141,133 people shows a substantial positive correlation between the proportion of Immigrants from Russia and percentage of households with 4 or more vehicles available in the United States with a correlation coefficient (R) of 0.598 and weighted average of 5.3%. On average, for every 1% (one percent) increase in Immigrants from Russia within a typical geography, there is an increase of 0.68% in percentage of households with 4 or more vehicles available.
It is essential to understand that the correlation between the percentage of Immigrants from Russia and percentage of households with 4 or more vehicles available does not imply a direct cause-and-effect relationship. It remains uncertain whether the presence of Immigrants from Russia influences an upward or downward trend in the level of percentage of households with 4 or more vehicles available within an area, or if Immigrants from Russia simply ended up residing in those areas with higher or lower levels of percentage of households with 4 or more vehicles available due to other factors.
Demographics Similar to Immigrants from Russia by 4 or more Vehicles in Household
In terms of 4 or more vehicles in household, the demographic groups most similar to Immigrants from Russia are Immigrants from Bosnia and Herzegovina (5.3%, a difference of 0.30%), Venezuelan (5.3%, a difference of 0.44%), Immigrants from Croatia (5.4%, a difference of 0.63%), Immigrants from Colombia (5.4%, a difference of 0.72%), and Immigrants from Liberia (5.4%, a difference of 0.76%).
| Demographics | Rating | Rank | 4 or more Vehicles in Household |
| Immigrants from Ireland | 0.3 /100 | #283 | Tragic 5.4% |
| Brazilians | 0.3 /100 | #284 | Tragic 5.4% |
| Immigrants from Liberia | 0.2 /100 | #285 | Tragic 5.4% |
| Immigrants from Colombia | 0.2 /100 | #286 | Tragic 5.4% |
| Immigrants from Croatia | 0.2 /100 | #287 | Tragic 5.4% |
| Venezuelans | 0.2 /100 | #288 | Tragic 5.3% |
| Immigrants from Bosnia and Herzegovina | 0.2 /100 | #289 | Tragic 5.3% |
| Immigrants from Russia | 0.2 /100 | #290 | Tragic 5.3% |
| Immigrants from Bahamas | 0.1 /100 | #291 | Tragic 5.3% |
| Liberians | 0.1 /100 | #292 | Tragic 5.3% |
| Immigrants from Congo | 0.1 /100 | #293 | Tragic 5.2% |
| Ghanaians | 0.1 /100 | #294 | Tragic 5.2% |
| Immigrants from Brazil | 0.1 /100 | #295 | Tragic 5.2% |
| Israelis | 0.1 /100 | #296 | Tragic 5.2% |
| Immigrants from Venezuela | 0.1 /100 | #297 | Tragic 5.2% |
Immigrants from Russia 4 or more Vehicles in Household Correlation Summary
| Measurement | Immigrants from Russia Data | 4 or more Vehicles in Household Data |
| Minimum | 0.071% | 0.50% |
| Maximum | 34.3% | 33.3% |
| Range | 34.2% | 32.8% |
| Mean | 6.3% | 7.9% |
| Median | 4.4% | 5.5% |
| Interquartile 25% (IQ1) | 2.1% | 3.0% |
| Interquartile 75% (IQ3) | 9.4% | 9.9% |
| Interquartile Range (IQR) | 7.3% | 6.9% |
| Standard Deviation (Sample) | 6.3% | 7.1% |
| Standard Deviation (Population) | 6.2% | 7.1% |
Correlation Details
| Immigrants from Russia Percentile | Sample Size | 4 or more Vehicles in Household |
[ 0.0% - 0.5% ] 0.071% | 226,882,041 | 6.8% |
[ 0.0% - 0.5% ] 0.24% | 56,504,952 | 6.0% |
[ 0.0% - 0.5% ] 0.40% | 25,478,128 | 5.9% |
[ 0.5% - 1.0% ] 0.60% | 12,584,809 | 5.5% |
[ 0.5% - 1.0% ] 0.73% | 14,181,252 | 2.6% |
[ 0.5% - 1.0% ] 0.94% | 3,187,433 | 5.6% |
[ 1.0% - 1.5% ] 1.12% | 1,844,703 | 5.4% |
[ 1.0% - 1.5% ] 1.28% | 1,519,116 | 5.7% |
[ 1.0% - 1.5% ] 1.45% | 1,143,620 | 5.2% |
[ 1.5% - 2.0% ] 1.62% | 719,596 | 4.2% |
[ 1.5% - 2.0% ] 1.78% | 288,943 | 3.9% |
[ 1.5% - 2.0% ] 1.99% | 212,937 | 7.8% |
[ 2.0% - 2.5% ] 2.13% | 271,378 | 5.2% |
[ 2.0% - 2.5% ] 2.30% | 146,179 | 5.5% |
[ 2.0% - 2.5% ] 2.48% | 101,696 | 7.1% |
[ 2.5% - 3.0% ] 2.66% | 177,354 | 2.7% |
[ 2.5% - 3.0% ] 2.81% | 254,380 | 1.4% |
[ 2.5% - 3.0% ] 2.97% | 130,750 | 4.6% |
[ 3.0% - 3.5% ] 3.12% | 127,710 | 1.4% |
[ 3.0% - 3.5% ] 3.38% | 11,700 | 2.2% |
[ 3.0% - 3.5% ] 3.46% | 52,191 | 1.8% |
[ 3.5% - 4.0% ] 3.68% | 9,462 | 9.3% |
[ 3.5% - 4.0% ] 3.89% | 4,905 | 14.1% |
[ 4.0% - 4.5% ] 4.08% | 21,217 | 6.7% |
[ 4.0% - 4.5% ] 4.19% | 18,866 | 9.1% |
[ 4.0% - 4.5% ] 4.44% | 2,768 | 20.8% |
[ 4.0% - 4.5% ] 4.47% | 179 | 7.1% |
[ 4.5% - 5.0% ] 4.72% | 1,993 | 17.6% |
[ 5.0% - 5.5% ] 5.08% | 7,389 | 3.0% |
[ 5.0% - 5.5% ] 5.25% | 22,677 | 1.0% |
[ 5.0% - 5.5% ] 5.36% | 261 | 13.5% |
[ 5.5% - 6.0% ] 5.58% | 2,704 | 8.0% |
[ 5.5% - 6.0% ] 5.77% | 81,109 | 0.92% |
[ 6.0% - 6.5% ] 6.35% | 63 | 5.0% |
[ 6.5% - 7.0% ] 6.53% | 1,990 | 2.0% |
[ 6.5% - 7.0% ] 6.83% | 1,318 | 10.5% |
[ 7.0% - 7.5% ] 7.28% | 47,893 | 1.1% |
[ 8.5% - 9.0% ] 8.89% | 2,564 | 9.9% |
[ 9.0% - 9.5% ] 9.41% | 574 | 3.3% |
[ 10.0% - 10.5% ] 10.00% | 80 | 19.4% |
[ 10.0% - 10.5% ] 10.13% | 3,338 | 4.1% |
[ 11.5% - 12.0% ] 11.66% | 83,069 | 0.50% |
[ 11.5% - 12.0% ] 11.90% | 462 | 12.7% |
[ 12.0% - 12.5% ] 12.34% | 154 | 15.1% |
[ 12.5% - 13.0% ] 12.64% | 1,543 | 4.4% |
[ 12.5% - 13.0% ] 12.88% | 427 | 14.2% |
[ 13.5% - 14.0% ] 13.61% | 1,102 | 2.0% |
[ 14.0% - 14.5% ] 14.19% | 867 | 4.9% |
[ 18.0% - 18.5% ] 18.25% | 126 | 33.3% |
[ 21.0% - 21.5% ] 21.10% | 891 | 22.8% |
[ 34.0% - 34.5% ] 34.31% | 274 | 28.4% |