Immigrants from Northern Africa Wage/Income Gap

COMPARE

Immigrants from Northern Africa
Race
Ancestry
AfghanAfricanAlaska NativeAlaskan AthabascanAlbanianAleutAlsatianAmericanApacheArabArapahoArgentineanArmenianAssyrian/Chaldean/SyriacAustralianAustrianBahamianBangladeshiBarbadianBasqueBelgianBelizeanBermudanBhutaneseBlackfeetBolivianBrazilianBritishBritish West IndianBulgarianBurmeseCajunCambodianCanadianCape VerdeanCarpatho RusynCelticCentral AmericanCentral American IndianCherokeeCheyenneChickasawChileanChineseChippewaChoctawColombianColvilleComancheCosta RicanCreeCreekCroatianCrowCubanCypriotCzechCzechoslovakianDanishDelawareDominicanDutchDutch West IndianEastern EuropeanEcuadorianEgyptianEnglishEstonianEthiopianEuropeanFijianFilipinoFinnishFrenchFrench American IndianFrench CanadianGermanGerman RussianGhanaianGreekGuamanian/ChamorroGuatemalanGuyaneseHaitianHmongHonduranHopiHoumaHungarianIcelanderIndian (Asian)IndonesianInupiatIranianIraqiIrishIroquoisIsraeliItalianJamaicanJapaneseJordanianKenyanKiowaKoreanLaotianLatvianLebaneseLiberianLithuanianLumbeeLuxembourgerMacedonianMalaysianMalteseMarshalleseMenomineeMexicanMexican American IndianMongolianMoroccanNative HawaiianNavajoNepaleseNew ZealanderNicaraguanNigerianNorthern EuropeanNorwegianOkinawanOsageOttawaPaiutePakistaniPalestinianPanamanianParaguayanPennsylvania GermanPeruvianPimaPolishPortuguesePotawatomiPuebloPuerto RicanPuget Sound SalishRomanianRussianSalvadoranSamoanScandinavianScotch-IrishScottishSeminoleSenegaleseSerbianShoshoneSierra LeoneanSiouxSlavicSlovakSloveneSomaliSouth AfricanSouth AmericanSouth American IndianSoviet UnionSpaniardSpanishSpanish AmericanSpanish American IndianSri LankanSubsaharan AfricanSudaneseSwedishSwissSyrianTaiwaneseThaiTlingit-HaidaTohono O'OdhamTonganTrinidadian and TobagonianTsimshianTurkishU.S. Virgin IslanderUgandanUkrainianUruguayanUteVenezuelanVietnameseWelshWest IndianYakamaYaquiYugoslavianYumanYup'ikZimbabwean
Immigration
NonimmigrantsImmigrantsAfghanistanAfricaAlbaniaArgentinaArmeniaAsiaAustraliaAustriaBahamasBangladeshBarbadosBelarusBelgiumBelizeBoliviaBosnia and HerzegovinaBrazilBulgariaBurma/MyanmarCabo VerdeCambodiaCameroonCanadaCaribbeanCentral AmericaChileChinaColombiaCongoCosta RicaCroatiaCubaCzechoslovakiaDenmarkDominicaDominican RepublicEastern AfricaEastern AsiaEastern EuropeEcuadorEgyptEl SalvadorEnglandEritreaEthiopiaEuropeFijiFranceGermanyGhanaGreeceGrenadaGuatemalaGuyanaHaitiHondurasHong KongHungaryIndiaIndonesiaIranIraqIrelandIsraelItalyJamaicaJapanJordanKazakhstanKenyaKoreaKuwaitLaosLatin AmericaLatviaLebanonLiberiaLithuaniaMalaysiaMexicoMicronesiaMiddle AfricaMoldovaMoroccoNepalNetherlandsNicaraguaNigeriaNorth AmericaNorth MacedoniaNorthern AfricaNorthern EuropeNorwayOceaniaPakistanPanamaPeruPhilippinesPolandPortugalRomaniaRussiaSaudi ArabiaScotlandSenegalSerbiaSierra LeoneSingaporeSomaliaSouth AfricaSouth AmericaSouth Central AsiaSouth Eastern AsiaSouthern EuropeSpainSri LankaSt. Vincent and the GrenadinesSudanSwedenSwitzerlandSyriaTaiwanThailandTrinidad and TobagoTurkeyUgandaUkraineUruguayUzbekistanVenezuelaVietnamWest IndiesWestern AfricaWestern AsiaWestern EuropeYemenZaireZimbabweAzores
Select to Compare
Race
Ancestry
AfghanAfricanAlaska NativeAlaskan AthabascanAlbanianAleutAlsatianAmericanApacheArabArapahoArgentineanArmenianAssyrian/Chaldean/SyriacAustralianAustrianBahamianBangladeshiBarbadianBasqueBelgianBelizeanBermudanBhutaneseBlackfeetBolivianBrazilianBritishBritish West IndianBulgarianBurmeseCajunCambodianCanadianCape VerdeanCarpatho RusynCelticCentral AmericanCentral American IndianCherokeeCheyenneChickasawChileanChineseChippewaChoctawColombianColvilleComancheCosta RicanCreeCreekCroatianCrowCubanCypriotCzechCzechoslovakianDanishDelawareDominicanDutchDutch West IndianEastern EuropeanEcuadorianEgyptianEnglishEstonianEthiopianEuropeanFijianFilipinoFinnishFrenchFrench American IndianFrench CanadianGermanGerman RussianGhanaianGreekGuamanian/ChamorroGuatemalanGuyaneseHaitianHmongHonduranHopiHoumaHungarianIcelanderIndian (Asian)IndonesianInupiatIranianIraqiIrishIroquoisIsraeliItalianJamaicanJapaneseJordanianKenyanKiowaKoreanLaotianLatvianLebaneseLiberianLithuanianLumbeeLuxembourgerMacedonianMalaysianMalteseMarshalleseMenomineeMexicanMexican American IndianMongolianMoroccanNative HawaiianNavajoNepaleseNew ZealanderNicaraguanNigerianNorthern EuropeanNorwegianOkinawanOsageOttawaPaiutePakistaniPalestinianPanamanianParaguayanPennsylvania GermanPeruvianPimaPolishPortuguesePotawatomiPuebloPuerto RicanPuget Sound SalishRomanianRussianSalvadoranSamoanScandinavianScotch-IrishScottishSeminoleSenegaleseSerbianShoshoneSierra LeoneanSiouxSlavicSlovakSloveneSomaliSouth AfricanSouth AmericanSouth American IndianSoviet UnionSpaniardSpanishSpanish AmericanSpanish American IndianSri LankanSubsaharan AfricanSudaneseSwedishSwissSyrianTaiwaneseThaiTlingit-HaidaTohono O'OdhamTonganTrinidadian and TobagonianTsimshianTurkishU.S. Virgin IslanderUgandanUkrainianUruguayanUteVenezuelanVietnameseWelshWest IndianYakamaYaquiYugoslavianYumanYup'ikZimbabwean
Immigration
NonimmigrantsImmigrantsAfghanistanAfricaAlbaniaArgentinaArmeniaAsiaAustraliaAustriaBahamasBangladeshBarbadosBelarusBelgiumBelizeBoliviaBosnia and HerzegovinaBrazilBulgariaBurma/MyanmarCabo VerdeCambodiaCameroonCanadaCaribbeanCentral AmericaChileChinaColombiaCongoCosta RicaCroatiaCubaCzechoslovakiaDenmarkDominicaDominican RepublicEastern AfricaEastern AsiaEastern EuropeEcuadorEgyptEl SalvadorEnglandEritreaEthiopiaEuropeFijiFranceGermanyGhanaGreeceGrenadaGuatemalaGuyanaHaitiHondurasHong KongHungaryIndiaIndonesiaIranIraqIrelandIsraelItalyJamaicaJapanJordanKazakhstanKenyaKoreaKuwaitLaosLatin AmericaLatviaLebanonLiberiaLithuaniaMalaysiaMexicoMicronesiaMiddle AfricaMoldovaMoroccoNepalNetherlandsNicaraguaNigeriaNorth AmericaNorth MacedoniaNorthern EuropeNorwayOceaniaPakistanPanamaPeruPhilippinesPolandPortugalRomaniaRussiaSaudi ArabiaScotlandSenegalSerbiaSierra LeoneSingaporeSomaliaSouth AfricaSouth AmericaSouth Central AsiaSouth Eastern AsiaSouthern EuropeSpainSri LankaSt. Vincent and the GrenadinesSudanSwedenSwitzerlandSyriaTaiwanThailandTrinidad and TobagoTurkeyUgandaUkraineUruguayUzbekistanVenezuelaVietnamWest IndiesWestern AfricaWestern AsiaWestern EuropeYemenZaireZimbabweAzores
Wage/Income Gap
Income
Poverty
Unemployment
Labor Participation
Family Structure
Vehicle Availability
Education Level
Disability

Immigrants from Northern Africa Wage/Income Gap
Good

25.2%
WAGE/INCOME GAP
78.1/ 100
METRIC RATING
154th/ 347
METRIC RANK

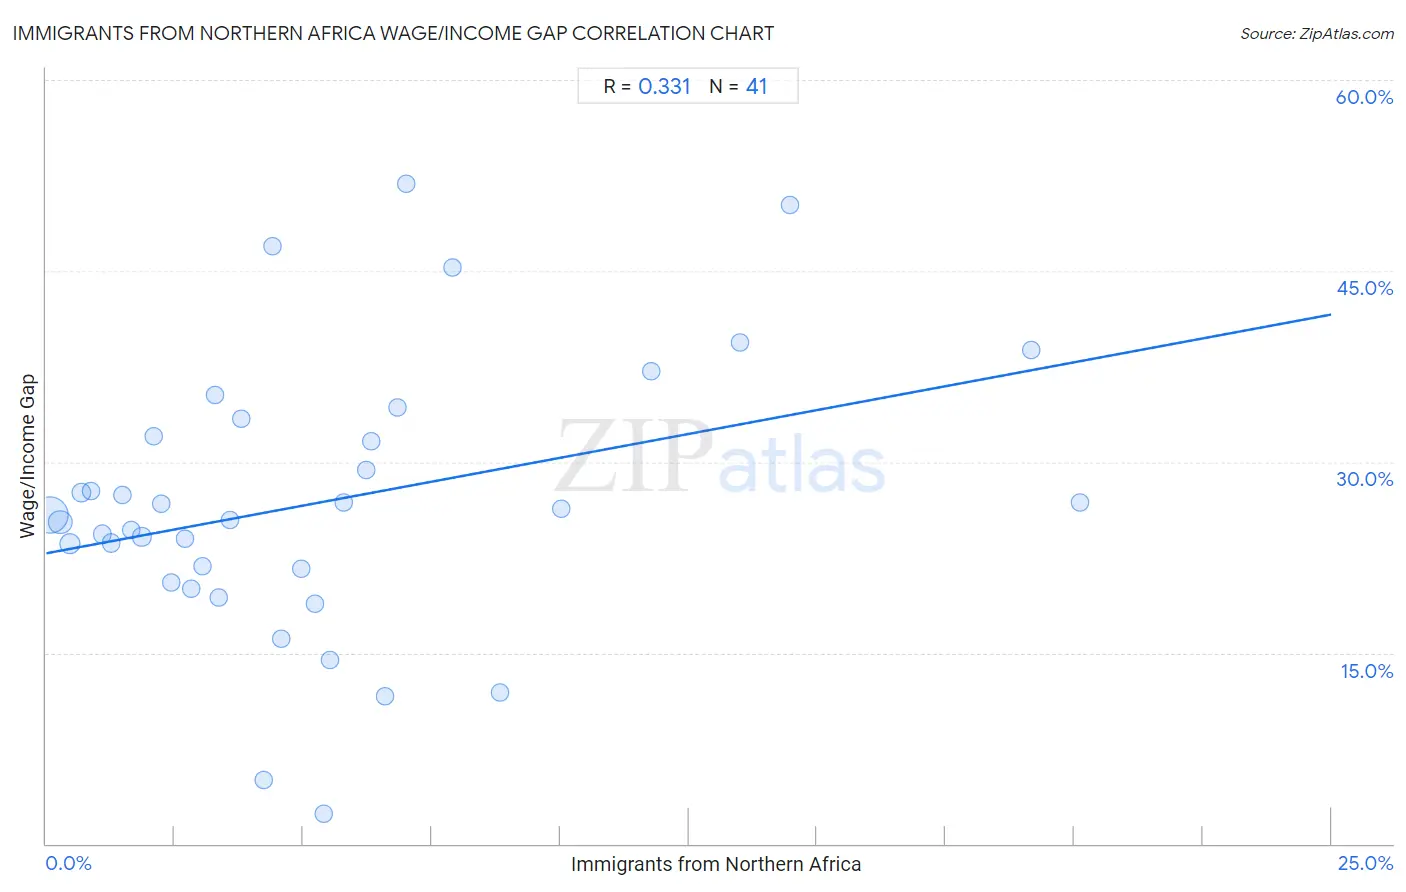
Immigrants from Northern Africa Wage/Income Gap Correlation Chart

The statistical analysis conducted on geographies consisting of 321,071,721 people shows a mild positive correlation between the proportion of Immigrants from Northern Africa and wage/income gap percentage in the United States with a correlation coefficient (R) of 0.331 and weighted average of 25.2%. On average, for every 1% (one percent) increase in Immigrants from Northern Africa within a typical geography, there is an increase of 0.75% in wage/income gap percentage.
Immigrants from Northern Africa Wage/Income Gap
It is essential to understand that the correlation between the percentage of Immigrants from Northern Africa and wage/income gap percentage does not imply a direct cause-and-effect relationship. It remains uncertain whether the presence of Immigrants from Northern Africa influences an upward or downward trend in the level of wage/income gap percentage within an area, or if Immigrants from Northern Africa simply ended up residing in those areas with higher or lower levels of wage/income gap percentage due to other factors.

Demographics Similar to Immigrants from Northern Africa by Wage/Income Gap

In terms of wage/income gap, the demographic groups most similar to Immigrants from Northern Africa are Blackfeet (25.2%, a difference of 0.010%), Immigrants from Vietnam (25.2%, a difference of 0.040%), Immigrants from Mexico (25.3%, a difference of 0.16%), Costa Rican (25.3%, a difference of 0.22%), and Uruguayan (25.2%, a difference of 0.33%).
DemographicsRating | RankWage/Income Gap
Malaysians
84.9
/100
|
#147
Excellent
25.0%
Iroquois
83.9
/100
|
#148
Excellent
25.1%
Immigrants from Peru
82.6
/100
|
#149
Excellent
25.1%
Immigrants
82.3
/100
|
#150
Excellent
25.1%
Taiwanese
81.6
/100
|
#151
Excellent
25.1%
Uruguayans
81.3
/100
|
#152
Excellent
25.2%
Blackfeet
78.1
/100
|
#153
Good
25.2%
Immigrants from Northern Africa
78.1
/100
|
#154
Good
25.2%
Immigrants from Vietnam
77.7
/100
|
#155
Good
25.2%
Immigrants from Mexico
76.4
/100
|
#156
Good
25.3%
Costa Ricans
75.8
/100
|
#157
Good
25.3%
Immigrants from Zimbabwe
73.7
/100
|
#158
Good
25.3%
Puget Sound Salish
73.0
/100
|
#159
Good
25.3%
French American Indians
72.5
/100
|
#160
Good
25.4%
Albanians
69.4
/100
|
#161
Good
25.4%

Immigrants from Northern Africa Wage/Income Gap Correlation Summary

MeasurementImmigrants from Northern Africa DataWage/Income Gap Data
Minimum0.085%2.3%
Maximum20.1%51.9%
Range20.0%49.5%
Mean5.3%26.8%
Median4.2%25.8%
Interquartile 25% (IQ1)2.0%21.1%
Interquartile 75% (IQ3)6.7%32.7%
Interquartile Range (IQR)4.7%11.6%
Standard Deviation (Sample)4.8%10.8%
Standard Deviation (Population)4.7%10.7%

Correlation Details

Immigrants from Northern Africa PercentileSample SizeWage/Income Gap
[
0.0%
-
0.5%
]
0.085%
203,379,38725.8%
[
0.0%
-
0.5%
]
0.27%
61,389,39025.3%
[
0.0%
-
0.5%
]
0.46%
28,690,91123.6%
[
0.5%
-
1.0%
]
0.68%
10,879,96327.6%
[
0.5%
-
1.0%
]
0.88%
5,057,37727.7%
[
1.0%
-
1.5%
]
1.09%
4,003,63224.3%
[
1.0%
-
1.5%
]
1.26%
2,401,73323.6%
[
1.0%
-
1.5%
]
1.48%
1,352,26727.4%
[
1.5%
-
2.0%
]
1.64%
827,33724.7%
[
1.5%
-
2.0%
]
1.86%
915,67724.1%
[
2.0%
-
2.5%
]
2.09%
220,91932.0%
[
2.0%
-
2.5%
]
2.24%
441,66326.7%
[
2.0%
-
2.5%
]
2.43%
161,52920.6%
[
2.5%
-
3.0%
]
2.70%
185,27124.0%
[
2.5%
-
3.0%
]
2.81%
388,93520.0%
[
3.0%
-
3.5%
]
3.04%
58,26721.8%
[
3.0%
-
3.5%
]
3.28%
57,00435.2%
[
3.0%
-
3.5%
]
3.35%
14,10219.3%
[
3.5%
-
4.0%
]
3.58%
24,99525.4%
[
3.5%
-
4.0%
]
3.80%
21,71333.4%
[
4.0%
-
4.5%
]
4.23%
48,6095.0%
[
4.0%
-
4.5%
]
4.41%
12,42447.0%
[
4.5%
-
5.0%
]
4.56%
33,62716.1%
[
4.5%
-
5.0%
]
4.96%
46,88721.6%
[
5.0%
-
5.5%
]
5.24%
223,53218.9%
[
5.0%
-
5.5%
]
5.40%
2,8152.3%
[
5.5%
-
6.0%
]
5.53%
51,69514.4%
[
5.5%
-
6.0%
]
5.80%
3,31326.8%
[
6.0%
-
6.5%
]
6.22%
8,81529.4%
[
6.0%
-
6.5%
]
6.32%
140,99431.6%
[
6.5%
-
7.0%
]
6.58%
5,00011.6%
[
6.5%
-
7.0%
]
6.82%
1,36334.3%
[
6.5%
-
7.0%
]
6.99%
14351.9%
[
7.5%
-
8.0%
]
7.90%
6,93845.3%
[
8.5%
-
9.0%
]
8.83%
1,15511.9%
[
10.0%
-
10.5%
]
10.02%
5,75126.3%
[
11.5%
-
12.0%
]
11.78%
3,05637.1%
[
13.0%
-
13.5%
]
13.49%
1,39439.3%
[
14.0%
-
14.5%
]
14.46%
33250.2%
[
19.0%
-
19.5%
]
19.16%
98138.8%
[
20.0%
-
20.5%
]
20.12%
82526.8%