Immigrants from Indonesia GED/Equivalency
COMPARE
Immigrants from Indonesia
Select to Compare
GED/Equivalency
Immigrants from Indonesia GED/Equivalency
86.4%
GED/EQUIVALENCY
82.4/ 100
METRIC RATING
142nd/ 347
METRIC RANK
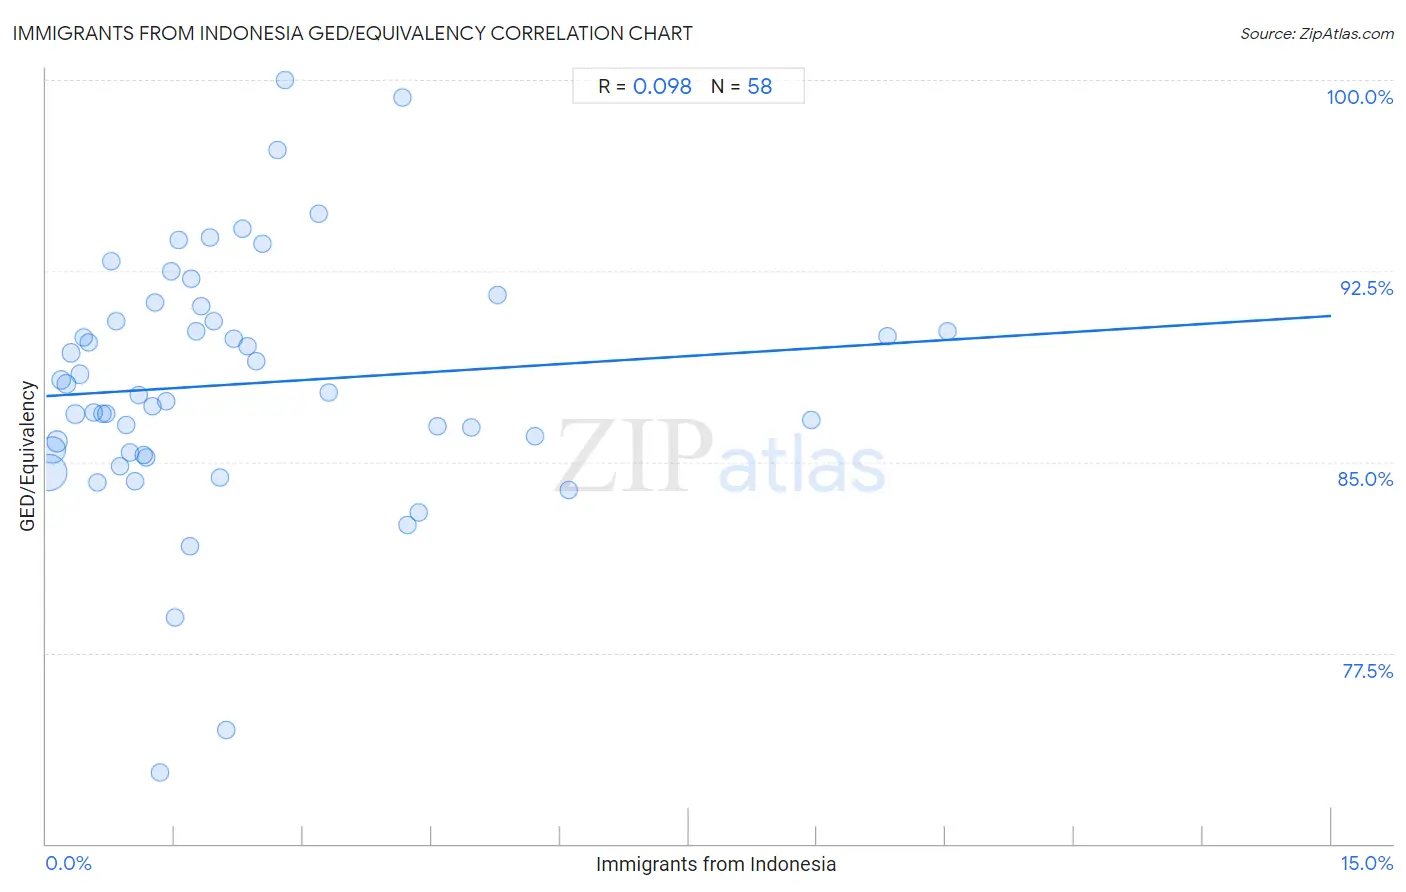
Immigrants from Indonesia GED/Equivalency Correlation Chart
The statistical analysis conducted on geographies consisting of 215,765,946 people shows a slight positive correlation between the proportion of Immigrants from Indonesia and percentage of population with at least ged/equivalency education in the United States with a correlation coefficient (R) of 0.098 and weighted average of 86.4%. On average, for every 1% (one percent) increase in Immigrants from Indonesia within a typical geography, there is an increase of 0.21% in percentage of population with at least ged/equivalency education.
It is essential to understand that the correlation between the percentage of Immigrants from Indonesia and percentage of population with at least ged/equivalency education does not imply a direct cause-and-effect relationship. It remains uncertain whether the presence of Immigrants from Indonesia influences an upward or downward trend in the level of percentage of population with at least ged/equivalency education within an area, or if Immigrants from Indonesia simply ended up residing in those areas with higher or lower levels of percentage of population with at least ged/equivalency education due to other factors.
Demographics Similar to Immigrants from Indonesia by GED/Equivalency
In terms of ged/equivalency, the demographic groups most similar to Immigrants from Indonesia are Immigrants from Pakistan (86.4%, a difference of 0.0%), Bolivian (86.4%, a difference of 0.010%), Laotian (86.5%, a difference of 0.030%), Paraguayan (86.5%, a difference of 0.060%), and Pakistani (86.4%, a difference of 0.070%).
| Demographics | Rating | Rank | GED/Equivalency |
| Immigrants from Asia | 87.4 /100 | #135 | Excellent 86.6% |
| Chileans | 86.9 /100 | #136 | Excellent 86.6% |
| Arabs | 86.7 /100 | #137 | Excellent 86.6% |
| Immigrants from Argentina | 86.5 /100 | #138 | Excellent 86.6% |
| Immigrants from Malaysia | 85.0 /100 | #139 | Excellent 86.5% |
| Paraguayans | 84.1 /100 | #140 | Excellent 86.5% |
| Laotians | 83.2 /100 | #141 | Excellent 86.5% |
| Immigrants from Indonesia | 82.4 /100 | #142 | Excellent 86.4% |
| Immigrants from Pakistan | 82.4 /100 | #143 | Excellent 86.4% |
| Bolivians | 82.1 /100 | #144 | Excellent 86.4% |
| Pakistanis | 80.4 /100 | #145 | Excellent 86.4% |
| Basques | 79.5 /100 | #146 | Good 86.4% |
| Immigrants from Northern Africa | 79.3 /100 | #147 | Good 86.3% |
| Immigrants from Poland | 79.3 /100 | #148 | Good 86.3% |
| Menominee | 79.3 /100 | #149 | Good 86.3% |
Immigrants from Indonesia GED/Equivalency Correlation Summary
| Measurement | Immigrants from Indonesia Data | GED/Equivalency Data |
| Minimum | 0.025% | 72.8% |
| Maximum | 10.5% | 100.0% |
| Range | 10.5% | 27.2% |
| Mean | 2.3% | 88.1% |
| Median | 1.5% | 87.7% |
| Interquartile 25% (IQ1) | 0.75% | 85.4% |
| Interquartile 75% (IQ3) | 2.7% | 90.5% |
| Interquartile Range (IQR) | 1.9% | 5.2% |
| Standard Deviation (Sample) | 2.3% | 5.0% |
| Standard Deviation (Population) | 2.3% | 4.9% |
Correlation Details
| Immigrants from Indonesia Percentile | Sample Size | GED/Equivalency |
[ 0.0% - 0.5% ] 0.025% | 113,816,663 | 84.6% |
[ 0.0% - 0.5% ] 0.075% | 53,815,004 | 85.5% |
[ 0.0% - 0.5% ] 0.13% | 20,853,793 | 85.8% |
[ 0.0% - 0.5% ] 0.18% | 8,297,452 | 88.2% |
[ 0.0% - 0.5% ] 0.24% | 6,230,421 | 88.1% |
[ 0.0% - 0.5% ] 0.29% | 2,913,593 | 89.3% |
[ 0.0% - 0.5% ] 0.34% | 3,245,319 | 86.9% |
[ 0.0% - 0.5% ] 0.39% | 1,371,621 | 88.4% |
[ 0.0% - 0.5% ] 0.44% | 1,003,421 | 89.9% |
[ 0.5% - 1.0% ] 0.50% | 624,802 | 89.7% |
[ 0.5% - 1.0% ] 0.55% | 677,470 | 87.0% |
[ 0.5% - 1.0% ] 0.60% | 724,963 | 84.2% |
[ 0.5% - 1.0% ] 0.66% | 473,086 | 86.9% |
[ 0.5% - 1.0% ] 0.71% | 316,094 | 86.9% |
[ 0.5% - 1.0% ] 0.75% | 247,842 | 92.9% |
[ 0.5% - 1.0% ] 0.81% | 78,346 | 90.5% |
[ 0.5% - 1.0% ] 0.86% | 210,643 | 84.8% |
[ 0.5% - 1.0% ] 0.93% | 90,850 | 86.5% |
[ 0.5% - 1.0% ] 0.97% | 75,843 | 85.4% |
[ 1.0% - 1.5% ] 1.04% | 25,174 | 84.2% |
[ 1.0% - 1.5% ] 1.08% | 19,188 | 87.6% |
[ 1.0% - 1.5% ] 1.13% | 125,583 | 85.3% |
[ 1.0% - 1.5% ] 1.17% | 59,795 | 85.2% |
[ 1.0% - 1.5% ] 1.24% | 60,124 | 87.2% |
[ 1.0% - 1.5% ] 1.27% | 12,762 | 91.3% |
[ 1.0% - 1.5% ] 1.32% | 111,183 | 72.8% |
[ 1.0% - 1.5% ] 1.40% | 4,496 | 87.4% |
[ 1.0% - 1.5% ] 1.46% | 2,949 | 92.5% |
[ 1.5% - 2.0% ] 1.50% | 2,860 | 78.9% |
[ 1.5% - 2.0% ] 1.55% | 12,166 | 93.7% |
[ 1.5% - 2.0% ] 1.67% | 68,325 | 81.7% |
[ 1.5% - 2.0% ] 1.69% | 2,538 | 92.2% |
[ 1.5% - 2.0% ] 1.76% | 55,333 | 90.1% |
[ 1.5% - 2.0% ] 1.82% | 2,368 | 91.1% |
[ 1.5% - 2.0% ] 1.92% | 1,462 | 93.8% |
[ 1.5% - 2.0% ] 1.95% | 205 | 90.5% |
[ 2.0% - 2.5% ] 2.02% | 44,107 | 84.4% |
[ 2.0% - 2.5% ] 2.10% | 286 | 74.5% |
[ 2.0% - 2.5% ] 2.18% | 30,255 | 89.9% |
[ 2.0% - 2.5% ] 2.29% | 6,154 | 94.2% |
[ 2.0% - 2.5% ] 2.35% | 1,746 | 89.6% |
[ 2.0% - 2.5% ] 2.46% | 4,150 | 88.9% |
[ 2.5% - 3.0% ] 2.52% | 1,983 | 93.6% |
[ 2.5% - 3.0% ] 2.70% | 10,918 | 97.2% |
[ 2.5% - 3.0% ] 2.78% | 467 | 100.0% |
[ 3.0% - 3.5% ] 3.18% | 472 | 94.8% |
[ 3.0% - 3.5% ] 3.29% | 23,054 | 87.7% |
[ 4.0% - 4.5% ] 4.16% | 985 | 99.3% |
[ 4.0% - 4.5% ] 4.22% | 1,138 | 82.5% |
[ 4.0% - 4.5% ] 4.35% | 1,012 | 83.0% |
[ 4.5% - 5.0% ] 4.57% | 634 | 86.4% |
[ 4.5% - 5.0% ] 4.95% | 222 | 86.3% |
[ 5.0% - 5.5% ] 5.26% | 171 | 91.5% |
[ 5.5% - 6.0% ] 5.70% | 193 | 86.0% |
[ 6.0% - 6.5% ] 6.10% | 738 | 83.9% |
[ 8.5% - 9.0% ] 8.94% | 1,634 | 86.7% |
[ 9.5% - 10.0% ] 9.83% | 977 | 89.9% |
[ 10.5% - 11.0% ] 10.51% | 913 | 90.1% |