Cherokee Receiving Food Stamps
COMPARE
Cherokee
Select to Compare
Receiving Food Stamps
Cherokee Receiving Food Stamps
13.2%
PUBLIC INCOME | FOOD STAMPS
2.5/ 100
METRIC RATING
233rd/ 347
METRIC RANK
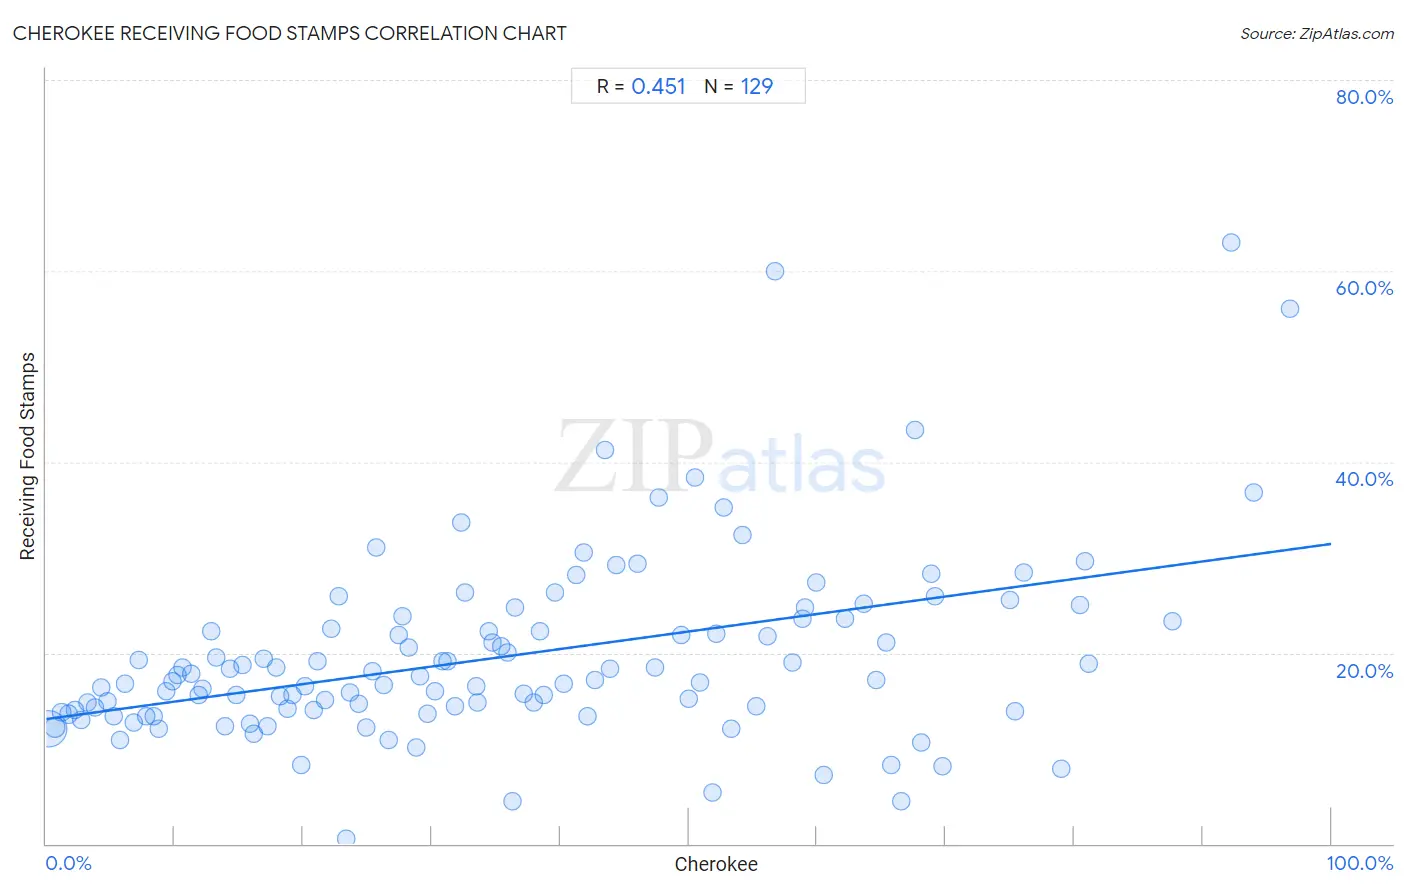
Cherokee Receiving Food Stamps Correlation Chart
The statistical analysis conducted on geographies consisting of 492,462,276 people shows a moderate positive correlation between the proportion of Cherokee and percentage of population receiving government assistance and/or food stamps in the United States with a correlation coefficient (R) of 0.451 and weighted average of 13.2%. On average, for every 1% (one percent) increase in Cherokee within a typical geography, there is an increase of 0.18% in percentage of population receiving government assistance and/or food stamps.
It is essential to understand that the correlation between the percentage of Cherokee and percentage of population receiving government assistance and/or food stamps does not imply a direct cause-and-effect relationship. It remains uncertain whether the presence of Cherokee influences an upward or downward trend in the level of percentage of population receiving government assistance and/or food stamps within an area, or if Cherokee simply ended up residing in those areas with higher or lower levels of percentage of population receiving government assistance and/or food stamps due to other factors.
Demographics Similar to Cherokee by Receiving Food Stamps
In terms of receiving food stamps, the demographic groups most similar to Cherokee are Comanche (13.3%, a difference of 0.13%), Salvadoran (13.2%, a difference of 0.26%), Immigrants from Zaire (13.4%, a difference of 0.90%), Immigrants from Nigeria (13.1%, a difference of 0.99%), and Puget Sound Salish (13.1%, a difference of 1.0%).
| Demographics | Rating | Rank | Receiving Food Stamps |
| Chickasaw | 3.6 /100 | #226 | Tragic 13.1% |
| Nigerians | 3.5 /100 | #227 | Tragic 13.1% |
| Panamanians | 3.5 /100 | #228 | Tragic 13.1% |
| Ottawa | 3.5 /100 | #229 | Tragic 13.1% |
| Puget Sound Salish | 3.4 /100 | #230 | Tragic 13.1% |
| Immigrants from Nigeria | 3.4 /100 | #231 | Tragic 13.1% |
| Salvadorans | 2.7 /100 | #232 | Tragic 13.2% |
| Cherokee | 2.5 /100 | #233 | Tragic 13.2% |
| Comanche | 2.4 /100 | #234 | Tragic 13.3% |
| Immigrants from Zaire | 1.9 /100 | #235 | Tragic 13.4% |
| Crow | 1.6 /100 | #236 | Tragic 13.4% |
| Immigrants from El Salvador | 1.5 /100 | #237 | Tragic 13.5% |
| French American Indians | 1.4 /100 | #238 | Tragic 13.5% |
| Immigrants from Micronesia | 1.3 /100 | #239 | Tragic 13.5% |
| Iroquois | 1.2 /100 | #240 | Tragic 13.5% |
Cherokee Receiving Food Stamps Correlation Summary
| Measurement | Cherokee Data | Receiving Food Stamps Data |
| Minimum | 0.20% | 0.50% |
| Maximum | 96.8% | 63.0% |
| Range | 96.6% | 62.5% |
| Mean | 35.8% | 19.6% |
| Median | 32.3% | 17.2% |
| Interquartile 25% (IQ1) | 16.0% | 14.0% |
| Interquartile 75% (IQ3) | 53.0% | 23.4% |
| Interquartile Range (IQR) | 37.0% | 9.4% |
| Standard Deviation (Sample) | 24.0% | 9.7% |
| Standard Deviation (Population) | 23.9% | 9.7% |
Correlation Details
| Cherokee Percentile | Sample Size | Receiving Food Stamps |
[ 0.0% - 0.5% ] 0.20% | 407,750,982 | 12.1% |
[ 0.5% - 1.0% ] 0.68% | 57,475,412 | 12.2% |
[ 1.0% - 1.5% ] 1.19% | 11,933,704 | 13.8% |
[ 1.5% - 2.0% ] 1.74% | 5,767,179 | 13.6% |
[ 2.0% - 2.5% ] 2.22% | 2,671,903 | 14.1% |
[ 2.5% - 3.0% ] 2.72% | 1,546,715 | 13.0% |
[ 3.0% - 3.5% ] 3.23% | 877,351 | 14.8% |
[ 3.5% - 4.0% ] 3.75% | 633,569 | 14.2% |
[ 4.0% - 4.5% ] 4.26% | 407,501 | 16.3% |
[ 4.5% - 5.0% ] 4.80% | 818,988 | 14.9% |
[ 5.0% - 5.5% ] 5.24% | 432,571 | 13.4% |
[ 5.5% - 6.0% ] 5.78% | 377,328 | 10.9% |
[ 6.0% - 6.5% ] 6.16% | 124,368 | 16.8% |
[ 6.5% - 7.0% ] 6.79% | 141,196 | 12.7% |
[ 7.0% - 7.5% ] 7.25% | 153,828 | 19.3% |
[ 7.5% - 8.0% ] 7.76% | 188,001 | 13.3% |
[ 8.0% - 8.5% ] 8.32% | 72,550 | 13.4% |
[ 8.5% - 9.0% ] 8.72% | 106,096 | 12.0% |
[ 9.0% - 9.5% ] 9.29% | 61,243 | 15.9% |
[ 9.5% - 10.0% ] 9.81% | 34,418 | 17.0% |
[ 10.0% - 10.5% ] 10.23% | 55,754 | 17.7% |
[ 10.5% - 11.0% ] 10.65% | 28,113 | 18.5% |
[ 11.0% - 11.5% ] 11.30% | 17,625 | 17.8% |
[ 11.5% - 12.0% ] 11.87% | 21,260 | 15.6% |
[ 12.0% - 12.5% ] 12.21% | 42,232 | 16.3% |
[ 12.5% - 13.0% ] 12.86% | 7,187 | 22.2% |
[ 13.0% - 13.5% ] 13.22% | 11,310 | 19.5% |
[ 13.5% - 14.0% ] 13.88% | 18,924 | 12.4% |
[ 14.0% - 14.5% ] 14.29% | 54,870 | 18.3% |
[ 14.5% - 15.0% ] 14.80% | 47,890 | 15.5% |
[ 15.0% - 15.5% ] 15.29% | 11,615 | 18.7% |
[ 15.5% - 16.0% ] 15.86% | 9,626 | 12.6% |
[ 16.0% - 16.5% ] 16.11% | 40,627 | 11.5% |
[ 16.5% - 17.0% ] 16.89% | 73,221 | 19.4% |
[ 17.0% - 17.5% ] 17.26% | 9,896 | 12.3% |
[ 17.5% - 18.0% ] 17.87% | 8,720 | 18.5% |
[ 18.0% - 18.5% ] 18.16% | 40,991 | 15.5% |
[ 18.5% - 19.0% ] 18.77% | 19,487 | 14.1% |
[ 19.0% - 19.5% ] 19.18% | 2,550 | 15.6% |
[ 19.5% - 20.0% ] 19.83% | 847 | 8.2% |
[ 20.0% - 20.5% ] 20.18% | 31,550 | 16.5% |
[ 20.5% - 21.0% ] 20.86% | 20,194 | 14.1% |
[ 21.0% - 21.5% ] 21.14% | 6,136 | 19.1% |
[ 21.5% - 22.0% ] 21.73% | 15,977 | 15.0% |
[ 22.0% - 22.5% ] 22.15% | 4,961 | 22.5% |
[ 22.5% - 23.0% ] 22.77% | 3,966 | 25.9% |
[ 23.0% - 23.5% ] 23.34% | 917 | 0.50% |
[ 23.5% - 24.0% ] 23.67% | 5,894 | 15.8% |
[ 24.0% - 24.5% ] 24.28% | 13,446 | 14.7% |
[ 24.5% - 25.0% ] 24.92% | 2,693 | 12.2% |
[ 25.0% - 25.5% ] 25.41% | 18,444 | 18.1% |
[ 25.5% - 26.0% ] 25.65% | 9,469 | 31.1% |
[ 26.0% - 26.5% ] 26.25% | 9,307 | 16.6% |
[ 26.5% - 27.0% ] 26.65% | 1,756 | 10.8% |
[ 27.0% - 27.5% ] 27.42% | 19,115 | 21.8% |
[ 27.5% - 28.0% ] 27.72% | 2,453 | 23.8% |
[ 28.0% - 28.5% ] 28.20% | 3,503 | 20.6% |
[ 28.5% - 29.0% ] 28.75% | 1,965 | 10.1% |
[ 29.0% - 29.5% ] 29.10% | 756 | 17.5% |
[ 29.5% - 30.0% ] 29.70% | 10,864 | 13.6% |
[ 30.0% - 30.5% ] 30.25% | 4,503 | 16.0% |
[ 30.5% - 31.0% ] 30.79% | 7,456 | 19.1% |
[ 31.0% - 31.5% ] 31.19% | 7,973 | 19.1% |
[ 31.5% - 32.0% ] 31.82% | 7,184 | 14.4% |
[ 32.0% - 32.5% ] 32.26% | 592 | 33.7% |
[ 32.5% - 33.0% ] 32.62% | 2,293 | 26.3% |
[ 33.0% - 33.5% ] 33.49% | 16,782 | 16.5% |
[ 33.5% - 34.0% ] 33.55% | 1,523 | 14.8% |
[ 34.0% - 34.5% ] 34.48% | 145 | 22.2% |
[ 34.5% - 35.0% ] 34.71% | 4,500 | 21.1% |
[ 35.0% - 35.5% ] 35.41% | 6,735 | 20.7% |
[ 35.5% - 36.0% ] 35.87% | 11,962 | 20.1% |
[ 36.0% - 36.5% ] 36.28% | 317 | 4.4% |
[ 36.5% - 37.0% ] 36.52% | 827 | 24.8% |
[ 37.0% - 37.5% ] 37.17% | 460 | 15.7% |
[ 37.5% - 38.0% ] 37.98% | 258 | 14.8% |
[ 38.0% - 38.5% ] 38.41% | 3,697 | 22.3% |
[ 38.5% - 39.0% ] 38.70% | 32,497 | 15.6% |
[ 39.5% - 40.0% ] 39.57% | 4,554 | 26.4% |
[ 40.0% - 40.5% ] 40.30% | 6,665 | 16.7% |
[ 41.0% - 41.5% ] 41.24% | 1,295 | 28.1% |
[ 41.5% - 42.0% ] 41.82% | 3,300 | 30.5% |
[ 42.0% - 42.5% ] 42.16% | 268 | 13.3% |
[ 42.5% - 43.0% ] 42.74% | 1,542 | 17.2% |
[ 43.0% - 43.5% ] 43.48% | 46 | 41.2% |
[ 43.5% - 44.0% ] 43.89% | 540 | 18.4% |
[ 44.0% - 44.5% ] 44.40% | 696 | 29.2% |
[ 46.0% - 46.5% ] 46.03% | 2,900 | 29.3% |
[ 47.0% - 47.5% ] 47.41% | 2,871 | 18.4% |
[ 47.5% - 48.0% ] 47.66% | 770 | 36.3% |
[ 49.0% - 49.5% ] 49.41% | 4,795 | 21.9% |
[ 50.0% - 50.5% ] 50.00% | 230 | 15.2% |
[ 50.0% - 50.5% ] 50.45% | 333 | 38.3% |
[ 50.5% - 51.0% ] 50.84% | 1,548 | 16.9% |
[ 51.5% - 52.0% ] 51.89% | 318 | 5.4% |
[ 52.0% - 52.5% ] 52.10% | 119 | 22.0% |
[ 52.5% - 53.0% ] 52.70% | 4,501 | 35.2% |
[ 53.0% - 53.5% ] 53.31% | 1,467 | 12.1% |
[ 54.0% - 54.5% ] 54.22% | 249 | 32.3% |
[ 55.0% - 55.5% ] 55.25% | 1,171 | 14.4% |
[ 56.0% - 56.5% ] 56.15% | 1,464 | 21.7% |
[ 56.5% - 57.0% ] 56.76% | 37 | 60.0% |
[ 58.0% - 58.5% ] 58.05% | 348 | 19.0% |
[ 58.5% - 59.0% ] 58.84% | 413 | 23.5% |
[ 59.0% - 59.5% ] 59.09% | 12,720 | 24.8% |
[ 59.5% - 60.0% ] 59.93% | 277 | 27.4% |
[ 60.0% - 60.5% ] 60.47% | 172 | 7.2% |
[ 62.0% - 62.5% ] 62.11% | 322 | 23.5% |
[ 63.5% - 64.0% ] 63.61% | 327 | 25.2% |
[ 64.5% - 65.0% ] 64.55% | 330 | 17.2% |
[ 65.0% - 65.5% ] 65.38% | 598 | 21.1% |
[ 65.5% - 66.0% ] 65.79% | 76 | 8.3% |
[ 66.5% - 67.0% ] 66.58% | 386 | 4.5% |
[ 67.5% - 68.0% ] 67.61% | 71 | 43.3% |
[ 68.0% - 68.5% ] 68.07% | 570 | 10.6% |
[ 68.5% - 69.0% ] 68.84% | 138 | 28.3% |
[ 69.0% - 69.5% ] 69.19% | 1,279 | 25.9% |
[ 69.5% - 70.0% ] 69.72% | 535 | 8.1% |
[ 75.0% - 75.5% ] 75.00% | 620 | 25.5% |
[ 75.0% - 75.5% ] 75.43% | 1,795 | 13.9% |
[ 76.0% - 76.5% ] 76.10% | 410 | 28.4% |
[ 79.0% - 79.5% ] 79.03% | 7,023 | 7.8% |
[ 80.0% - 80.5% ] 80.43% | 46 | 25.0% |
[ 80.5% - 81.0% ] 80.85% | 726 | 29.6% |
[ 81.0% - 81.5% ] 81.08% | 37 | 18.9% |
[ 87.5% - 88.0% ] 87.63% | 97 | 23.3% |
[ 92.0% - 92.5% ] 92.21% | 154 | 63.0% |
[ 93.5% - 94.0% ] 93.94% | 66 | 36.8% |
[ 96.5% - 97.0% ] 96.79% | 343 | 56.1% |