Apache Disability
COMPARE
Apache
Select to Compare
Disability
Apache Disability
13.9%
DISABILITY
0.0/ 100
METRIC RATING
320th/ 347
METRIC RANK
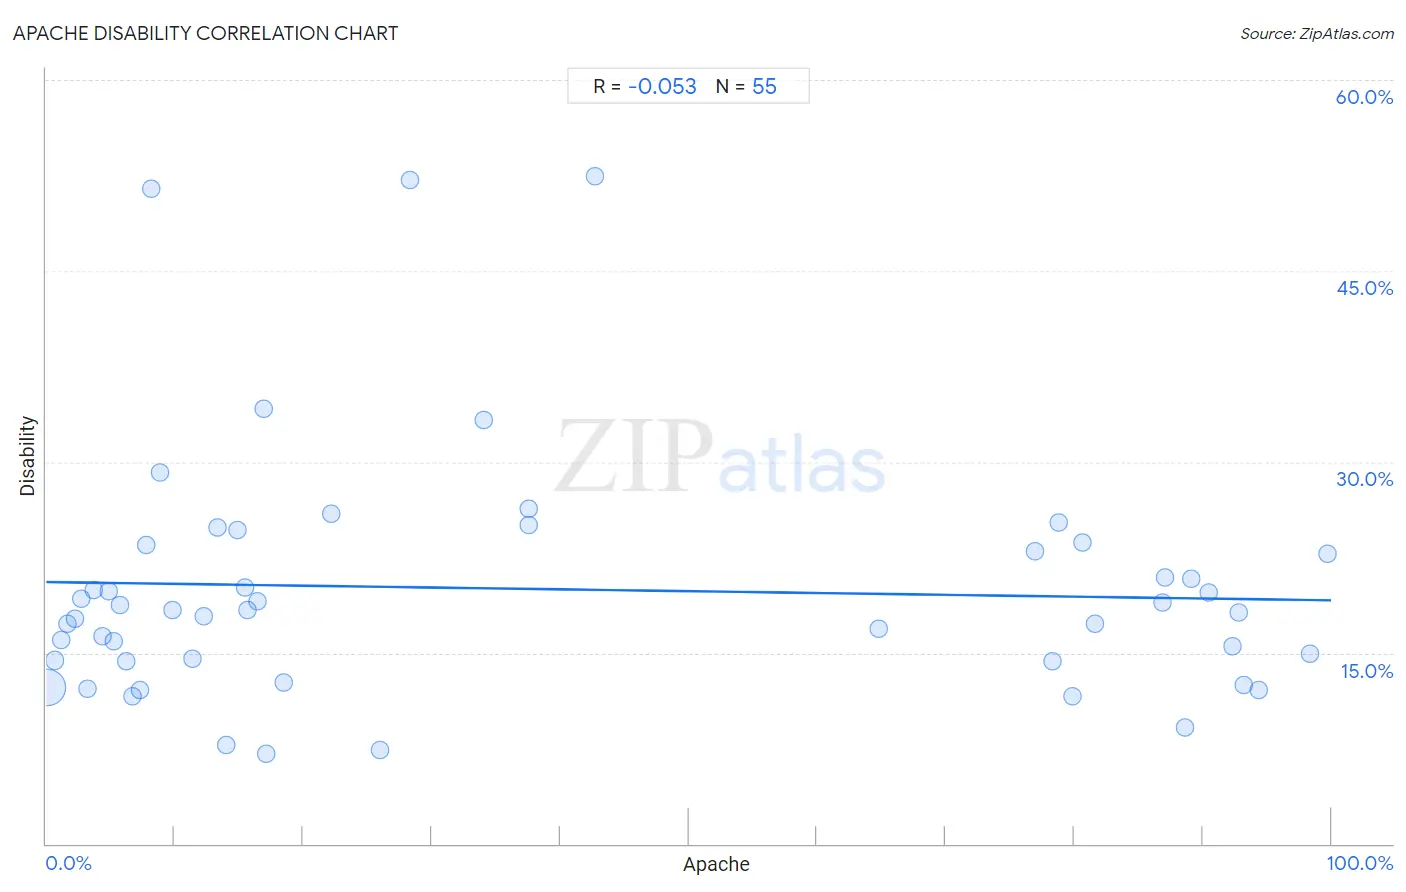
Apache Disability Correlation Chart
The statistical analysis conducted on geographies consisting of 231,070,506 people shows a slight negative correlation between the proportion of Apache and percentage of population with a disability in the United States with a correlation coefficient (R) of -0.053 and weighted average of 13.9%. On average, for every 1% (one percent) increase in Apache within a typical geography, there is a decrease of 0.014% in percentage of population with a disability.
It is essential to understand that the correlation between the percentage of Apache and percentage of population with a disability does not imply a direct cause-and-effect relationship. It remains uncertain whether the presence of Apache influences an upward or downward trend in the level of percentage of population with a disability within an area, or if Apache simply ended up residing in those areas with higher or lower levels of percentage of population with a disability due to other factors.
Demographics Similar to Apache by Disability
In terms of disability, the demographic groups most similar to Apache are Paiute (13.9%, a difference of 0.13%), Iroquois (13.8%, a difference of 0.29%), Menominee (13.8%, a difference of 0.51%), American (13.9%, a difference of 0.55%), and Pima (13.7%, a difference of 1.1%).
| Demographics | Rating | Rank | Disability |
| Cree | 0.0 /100 | #313 | Tragic 13.7% |
| Blacks/African Americans | 0.0 /100 | #314 | Tragic 13.7% |
| Puget Sound Salish | 0.0 /100 | #315 | Tragic 13.7% |
| Pima | 0.0 /100 | #316 | Tragic 13.7% |
| Immigrants from Cabo Verde | 0.0 /100 | #317 | Tragic 13.7% |
| Menominee | 0.0 /100 | #318 | Tragic 13.8% |
| Iroquois | 0.0 /100 | #319 | Tragic 13.8% |
| Apache | 0.0 /100 | #320 | Tragic 13.9% |
| Paiute | 0.0 /100 | #321 | Tragic 13.9% |
| Americans | 0.0 /100 | #322 | Tragic 13.9% |
| Comanche | 0.0 /100 | #323 | Tragic 14.1% |
| Chippewa | 0.0 /100 | #324 | Tragic 14.1% |
| Natives/Alaskans | 0.0 /100 | #325 | Tragic 14.2% |
| Osage | 0.0 /100 | #326 | Tragic 14.2% |
| Ottawa | 0.0 /100 | #327 | Tragic 14.2% |
Apache Disability Correlation Summary
| Measurement | Apache Data | Disability Data |
| Minimum | 0.085% | 7.1% |
| Maximum | 99.7% | 52.4% |
| Range | 99.7% | 45.3% |
| Mean | 37.1% | 20.0% |
| Median | 17.0% | 18.3% |
| Interquartile 25% (IQ1) | 6.7% | 14.4% |
| Interquartile 75% (IQ3) | 79.9% | 23.5% |
| Interquartile Range (IQR) | 73.1% | 9.1% |
| Standard Deviation (Sample) | 36.2% | 9.7% |
| Standard Deviation (Population) | 35.9% | 9.6% |
Correlation Details
| Apache Percentile | Sample Size | Disability |
[ 0.0% - 0.5% ] 0.085% | 224,554,868 | 12.3% |
[ 0.5% - 1.0% ] 0.67% | 4,781,084 | 14.4% |
[ 1.0% - 1.5% ] 1.20% | 906,759 | 16.0% |
[ 1.5% - 2.0% ] 1.68% | 332,860 | 17.3% |
[ 2.0% - 2.5% ] 2.24% | 177,989 | 17.7% |
[ 2.5% - 3.0% ] 2.69% | 55,900 | 19.3% |
[ 3.0% - 3.5% ] 3.22% | 44,304 | 12.1% |
[ 3.5% - 4.0% ] 3.73% | 12,042 | 19.9% |
[ 4.0% - 4.5% ] 4.34% | 42,778 | 16.3% |
[ 4.5% - 5.0% ] 4.83% | 27,540 | 19.9% |
[ 5.0% - 5.5% ] 5.26% | 33,659 | 15.9% |
[ 5.5% - 6.0% ] 5.72% | 11,702 | 18.7% |
[ 6.0% - 6.5% ] 6.23% | 3,289 | 14.3% |
[ 6.5% - 7.0% ] 6.75% | 963 | 11.6% |
[ 7.0% - 7.5% ] 7.29% | 2,482 | 12.0% |
[ 7.5% - 8.0% ] 7.79% | 1,027 | 23.5% |
[ 8.0% - 8.5% ] 8.18% | 489 | 51.4% |
[ 8.5% - 9.0% ] 8.84% | 848 | 29.1% |
[ 9.5% - 10.0% ] 9.80% | 8,287 | 18.4% |
[ 11.0% - 11.5% ] 11.35% | 414 | 14.5% |
[ 12.0% - 12.5% ] 12.30% | 6,319 | 17.8% |
[ 13.0% - 13.5% ] 13.33% | 225 | 24.9% |
[ 14.0% - 14.5% ] 14.02% | 271 | 7.7% |
[ 14.5% - 15.0% ] 14.90% | 2,563 | 24.6% |
[ 15.0% - 15.5% ] 15.50% | 342 | 20.2% |
[ 15.5% - 16.0% ] 15.69% | 1,479 | 18.3% |
[ 16.0% - 16.5% ] 16.44% | 1,928 | 19.1% |
[ 16.5% - 17.0% ] 16.97% | 442 | 34.2% |
[ 17.0% - 17.5% ] 17.16% | 169 | 7.1% |
[ 18.0% - 18.5% ] 18.45% | 618 | 12.6% |
[ 22.0% - 22.5% ] 22.22% | 27 | 25.9% |
[ 26.0% - 26.5% ] 26.02% | 246 | 7.3% |
[ 28.0% - 28.5% ] 28.26% | 46 | 52.2% |
[ 34.0% - 34.5% ] 34.01% | 147 | 33.3% |
[ 37.0% - 37.5% ] 37.50% | 16 | 25.0% |
[ 37.5% - 38.0% ] 37.59% | 133 | 26.3% |
[ 42.5% - 43.0% ] 42.73% | 227 | 52.4% |
[ 64.5% - 65.0% ] 64.77% | 457 | 16.8% |
[ 76.5% - 77.0% ] 76.94% | 2,650 | 23.0% |
[ 78.0% - 78.5% ] 78.32% | 7,067 | 14.4% |
[ 78.5% - 79.0% ] 78.81% | 2,261 | 25.3% |
[ 79.5% - 80.0% ] 79.86% | 4,405 | 11.6% |
[ 80.5% - 81.0% ] 80.68% | 4,860 | 23.6% |
[ 81.5% - 82.0% ] 81.63% | 980 | 17.2% |
[ 86.5% - 87.0% ] 86.87% | 11,840 | 18.9% |
[ 87.0% - 87.5% ] 87.10% | 837 | 20.9% |
[ 88.5% - 89.0% ] 88.65% | 3,049 | 9.2% |
[ 89.0% - 89.5% ] 89.14% | 1,621 | 20.9% |
[ 90.0% - 90.5% ] 90.48% | 4,284 | 19.8% |
[ 92.0% - 92.5% ] 92.28% | 3,110 | 15.6% |
[ 92.5% - 93.0% ] 92.84% | 1,592 | 18.2% |
[ 93.0% - 93.5% ] 93.19% | 2,173 | 12.5% |
[ 94.0% - 94.5% ] 94.31% | 2,497 | 12.1% |
[ 98.0% - 98.5% ] 98.39% | 1,552 | 14.9% |
[ 99.5% - 100.0% ] 99.75% | 789 | 22.8% |