Yugoslavian vs Immigrants from Russia 2 or more Vehicles in Household
COMPARE
Yugoslavian
Immigrants from Russia
2 or more Vehicles in Household
2 or more Vehicles in Household Comparison
Yugoslavians
Immigrants from Russia
56.6%
2 OR MORE VEHICLES IN HOUSEHOLD
90.0/ 100
METRIC RATING
130th/ 347
METRIC RANK
50.3%
2 OR MORE VEHICLES IN HOUSEHOLD
0.0/ 100
METRIC RATING
300th/ 347
METRIC RANK
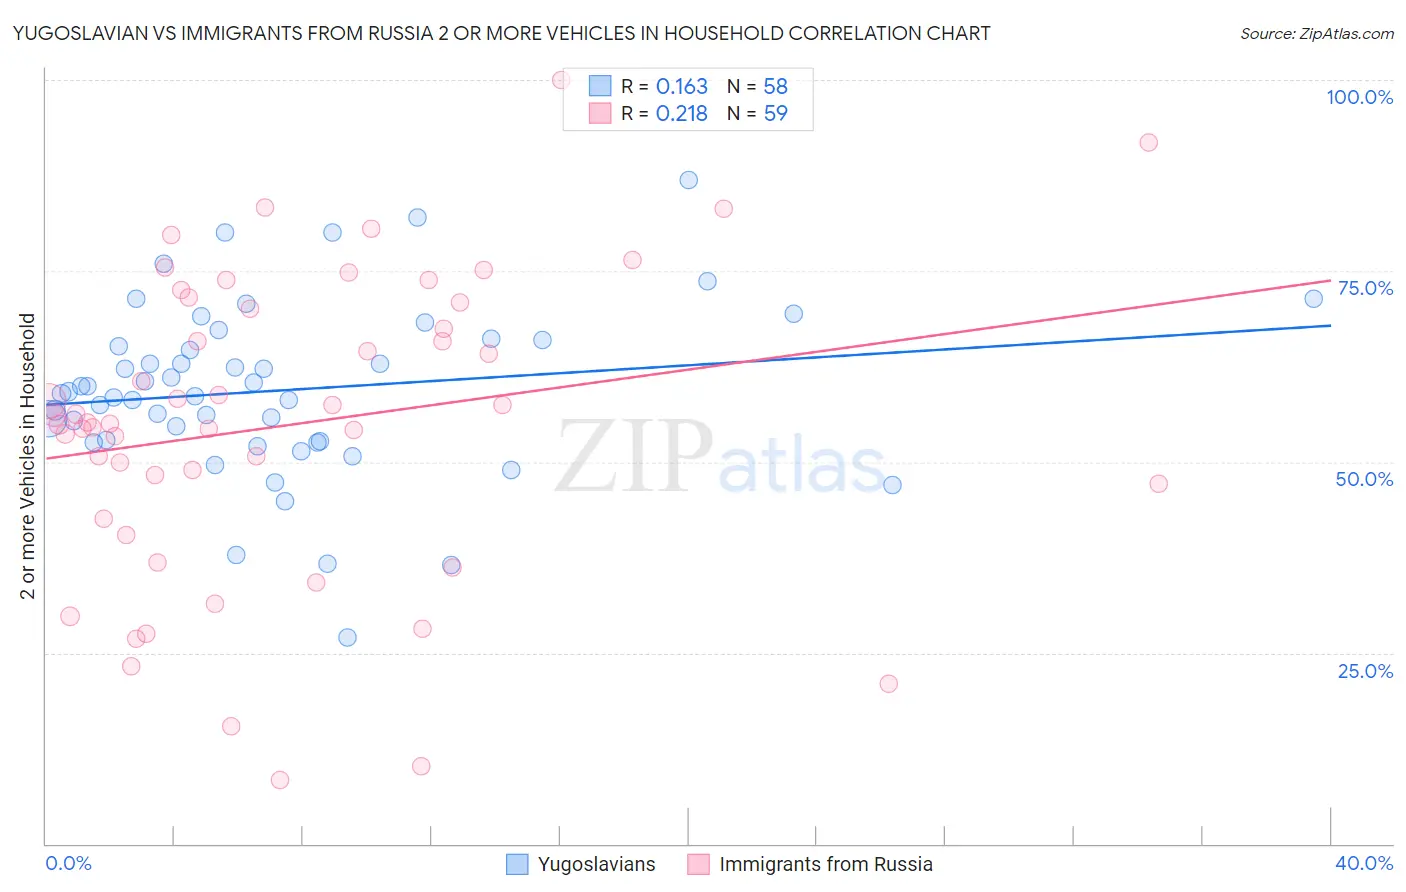
Yugoslavian vs Immigrants from Russia 2 or more Vehicles in Household Correlation Chart
The statistical analysis conducted on geographies consisting of 285,645,335 people shows a poor positive correlation between the proportion of Yugoslavians and percentage of households with 2 or more vehicles available in the United States with a correlation coefficient (R) of 0.163 and weighted average of 56.6%. Similarly, the statistical analysis conducted on geographies consisting of 347,736,627 people shows a weak positive correlation between the proportion of Immigrants from Russia and percentage of households with 2 or more vehicles available in the United States with a correlation coefficient (R) of 0.218 and weighted average of 50.3%, a difference of 12.4%.
2 or more Vehicles in Household Correlation Summary
| Measurement | Yugoslavian | Immigrants from Russia |
| Minimum | 27.0% | 8.3% |
| Maximum | 87.0% | 100.0% |
| Range | 59.9% | 91.7% |
| Mean | 59.4% | 54.9% |
| Median | 59.1% | 55.2% |
| Interquartile 25% (IQ1) | 52.7% | 42.6% |
| Interquartile 75% (IQ3) | 66.0% | 70.9% |
| Interquartile Range (IQR) | 13.3% | 28.3% |
| Standard Deviation (Sample) | 11.3% | 20.1% |
| Standard Deviation (Population) | 11.2% | 19.9% |
Similar Demographics by 2 or more Vehicles in Household
Demographics Similar to Yugoslavians by 2 or more Vehicles in Household
In terms of 2 or more vehicles in household, the demographic groups most similar to Yugoslavians are Bulgarian (56.5%, a difference of 0.030%), Ute (56.6%, a difference of 0.040%), Immigrants from South Central Asia (56.6%, a difference of 0.060%), Immigrants from Thailand (56.6%, a difference of 0.070%), and Hungarian (56.5%, a difference of 0.090%).
| Demographics | Rating | Rank | 2 or more Vehicles in Household |
| Australians | 91.8 /100 | #123 | Exceptional 56.7% |
| New Zealanders | 91.8 /100 | #124 | Exceptional 56.7% |
| Tsimshian | 91.6 /100 | #125 | Exceptional 56.7% |
| Estonians | 90.9 /100 | #126 | Exceptional 56.6% |
| Immigrants | Thailand | 90.7 /100 | #127 | Exceptional 56.6% |
| Immigrants | South Central Asia | 90.5 /100 | #128 | Exceptional 56.6% |
| Ute | 90.4 /100 | #129 | Exceptional 56.6% |
| Yugoslavians | 90.0 /100 | #130 | Exceptional 56.6% |
| Bulgarians | 89.7 /100 | #131 | Excellent 56.5% |
| Hungarians | 89.1 /100 | #132 | Excellent 56.5% |
| Comanche | 88.4 /100 | #133 | Excellent 56.5% |
| Immigrants | Azores | 86.6 /100 | #134 | Excellent 56.4% |
| Blackfeet | 86.5 /100 | #135 | Excellent 56.4% |
| Immigrants | Asia | 86.0 /100 | #136 | Excellent 56.3% |
| Cubans | 84.8 /100 | #137 | Excellent 56.3% |
Demographics Similar to Immigrants from Russia by 2 or more Vehicles in Household
In terms of 2 or more vehicles in household, the demographic groups most similar to Immigrants from Russia are Immigrants from Morocco (50.3%, a difference of 0.040%), Paraguayan (50.3%, a difference of 0.070%), Immigrants from Greece (50.2%, a difference of 0.18%), Immigrants from Spain (50.4%, a difference of 0.20%), and Immigrants from South America (50.2%, a difference of 0.24%).
| Demographics | Rating | Rank | 2 or more Vehicles in Household |
| Blacks/African Americans | 0.0 /100 | #293 | Tragic 50.9% |
| Bermudans | 0.0 /100 | #294 | Tragic 50.6% |
| Cypriots | 0.0 /100 | #295 | Tragic 50.6% |
| Immigrants | Somalia | 0.0 /100 | #296 | Tragic 50.5% |
| Immigrants | Spain | 0.0 /100 | #297 | Tragic 50.4% |
| Paraguayans | 0.0 /100 | #298 | Tragic 50.3% |
| Immigrants | Morocco | 0.0 /100 | #299 | Tragic 50.3% |
| Immigrants | Russia | 0.0 /100 | #300 | Tragic 50.3% |
| Immigrants | Greece | 0.0 /100 | #301 | Tragic 50.2% |
| Immigrants | South America | 0.0 /100 | #302 | Tragic 50.2% |
| Tohono O'odham | 0.0 /100 | #303 | Tragic 50.0% |
| Immigrants | Belize | 0.0 /100 | #304 | Tragic 49.9% |
| Immigrants | Western Africa | 0.0 /100 | #305 | Tragic 49.4% |
| Immigrants | Israel | 0.0 /100 | #306 | Tragic 49.2% |
| Hopi | 0.0 /100 | #307 | Tragic 49.0% |