Yugoslavian vs Immigrants from Bahamas 2 or more Vehicles in Household
COMPARE
Yugoslavian
Immigrants from Bahamas
2 or more Vehicles in Household
2 or more Vehicles in Household Comparison
Yugoslavians
Immigrants from Bahamas
56.6%
2 OR MORE VEHICLES IN HOUSEHOLD
90.0/ 100
METRIC RATING
130th/ 347
METRIC RANK
52.5%
2 OR MORE VEHICLES IN HOUSEHOLD
0.5/ 100
METRIC RATING
260th/ 347
METRIC RANK
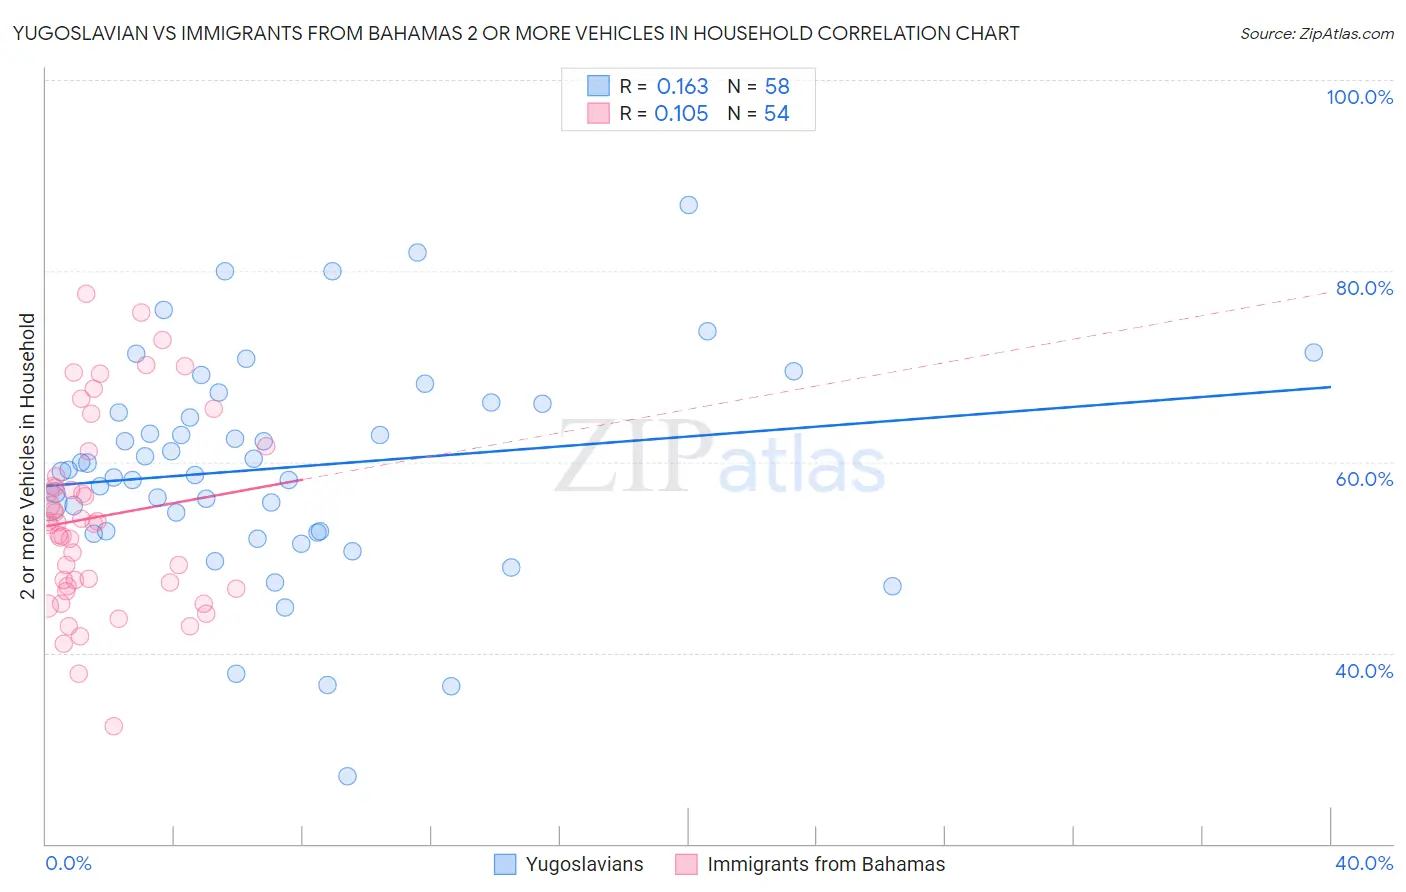
Yugoslavian vs Immigrants from Bahamas 2 or more Vehicles in Household Correlation Chart
The statistical analysis conducted on geographies consisting of 285,645,335 people shows a poor positive correlation between the proportion of Yugoslavians and percentage of households with 2 or more vehicles available in the United States with a correlation coefficient (R) of 0.163 and weighted average of 56.6%. Similarly, the statistical analysis conducted on geographies consisting of 104,618,237 people shows a poor positive correlation between the proportion of Immigrants from Bahamas and percentage of households with 2 or more vehicles available in the United States with a correlation coefficient (R) of 0.105 and weighted average of 52.5%, a difference of 7.8%.
2 or more Vehicles in Household Correlation Summary
| Measurement | Yugoslavian | Immigrants from Bahamas |
| Minimum | 27.0% | 32.3% |
| Maximum | 87.0% | 77.7% |
| Range | 59.9% | 45.4% |
| Mean | 59.4% | 54.3% |
| Median | 59.1% | 53.6% |
| Interquartile 25% (IQ1) | 52.7% | 46.9% |
| Interquartile 75% (IQ3) | 66.0% | 58.5% |
| Interquartile Range (IQR) | 13.3% | 11.6% |
| Standard Deviation (Sample) | 11.3% | 10.0% |
| Standard Deviation (Population) | 11.2% | 9.9% |
Similar Demographics by 2 or more Vehicles in Household
Demographics Similar to Yugoslavians by 2 or more Vehicles in Household
In terms of 2 or more vehicles in household, the demographic groups most similar to Yugoslavians are Bulgarian (56.5%, a difference of 0.030%), Ute (56.6%, a difference of 0.040%), Immigrants from South Central Asia (56.6%, a difference of 0.060%), Immigrants from Thailand (56.6%, a difference of 0.070%), and Hungarian (56.5%, a difference of 0.090%).
| Demographics | Rating | Rank | 2 or more Vehicles in Household |
| Australians | 91.8 /100 | #123 | Exceptional 56.7% |
| New Zealanders | 91.8 /100 | #124 | Exceptional 56.7% |
| Tsimshian | 91.6 /100 | #125 | Exceptional 56.7% |
| Estonians | 90.9 /100 | #126 | Exceptional 56.6% |
| Immigrants | Thailand | 90.7 /100 | #127 | Exceptional 56.6% |
| Immigrants | South Central Asia | 90.5 /100 | #128 | Exceptional 56.6% |
| Ute | 90.4 /100 | #129 | Exceptional 56.6% |
| Yugoslavians | 90.0 /100 | #130 | Exceptional 56.6% |
| Bulgarians | 89.7 /100 | #131 | Excellent 56.5% |
| Hungarians | 89.1 /100 | #132 | Excellent 56.5% |
| Comanche | 88.4 /100 | #133 | Excellent 56.5% |
| Immigrants | Azores | 86.6 /100 | #134 | Excellent 56.4% |
| Blackfeet | 86.5 /100 | #135 | Excellent 56.4% |
| Immigrants | Asia | 86.0 /100 | #136 | Excellent 56.3% |
| Cubans | 84.8 /100 | #137 | Excellent 56.3% |
Demographics Similar to Immigrants from Bahamas by 2 or more Vehicles in Household
In terms of 2 or more vehicles in household, the demographic groups most similar to Immigrants from Bahamas are Immigrants from Australia (52.4%, a difference of 0.030%), Alsatian (52.5%, a difference of 0.070%), Central American Indian (52.5%, a difference of 0.10%), Immigrants from Hong Kong (52.6%, a difference of 0.20%), and Immigrants from Northern Africa (52.3%, a difference of 0.23%).
| Demographics | Rating | Rank | 2 or more Vehicles in Household |
| Nigerians | 0.9 /100 | #253 | Tragic 52.8% |
| Immigrants | Malaysia | 0.8 /100 | #254 | Tragic 52.7% |
| Uruguayans | 0.7 /100 | #255 | Tragic 52.7% |
| Immigrants | Eritrea | 0.7 /100 | #256 | Tragic 52.6% |
| Immigrants | Hong Kong | 0.6 /100 | #257 | Tragic 52.6% |
| Central American Indians | 0.6 /100 | #258 | Tragic 52.5% |
| Alsatians | 0.6 /100 | #259 | Tragic 52.5% |
| Immigrants | Bahamas | 0.5 /100 | #260 | Tragic 52.5% |
| Immigrants | Australia | 0.5 /100 | #261 | Tragic 52.4% |
| Immigrants | Northern Africa | 0.4 /100 | #262 | Tragic 52.3% |
| Immigrants | Southern Europe | 0.4 /100 | #263 | Tragic 52.3% |
| Immigrants | Latvia | 0.4 /100 | #264 | Tragic 52.2% |
| Immigrants | Congo | 0.3 /100 | #265 | Tragic 52.1% |
| Immigrants | France | 0.2 /100 | #266 | Tragic 52.0% |
| Immigrants | Colombia | 0.2 /100 | #267 | Tragic 52.0% |