Yugoslavian vs Immigrants from Russia Householder Income Ages 45 - 64 years
COMPARE
Yugoslavian
Immigrants from Russia
Householder Income Ages 45 - 64 years
Householder Income Ages 45 - 64 years Comparison
Yugoslavians
Immigrants from Russia
$97,558
HOUSEHOLDER INCOME AGES 45 - 64 YEARS
20.0/ 100
METRIC RATING
201st/ 347
METRIC RANK
$113,215
HOUSEHOLDER INCOME AGES 45 - 64 YEARS
99.8/ 100
METRIC RATING
49th/ 347
METRIC RANK
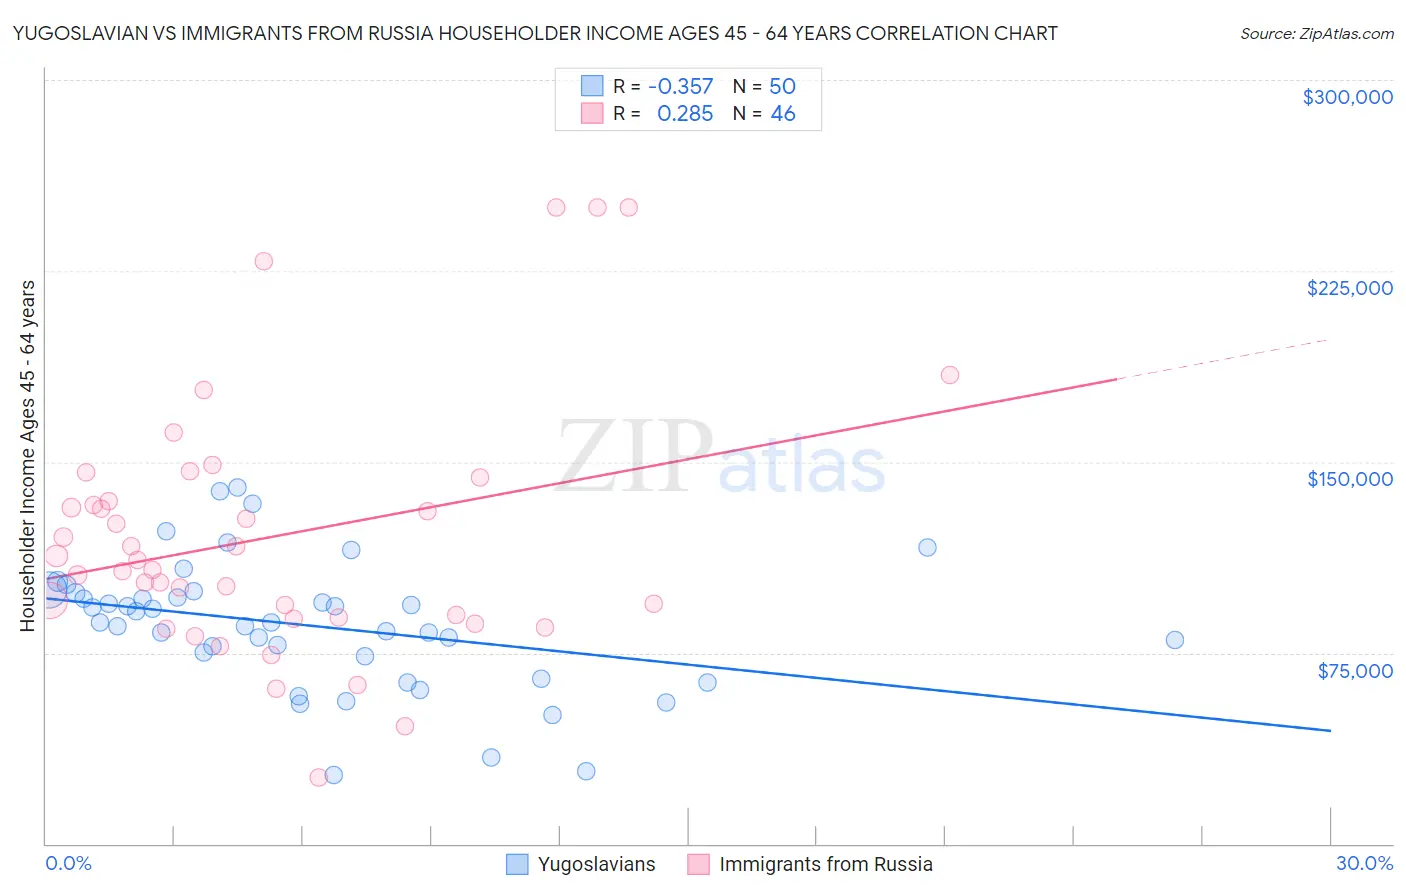
Yugoslavian vs Immigrants from Russia Householder Income Ages 45 - 64 years Correlation Chart
The statistical analysis conducted on geographies consisting of 285,465,008 people shows a mild negative correlation between the proportion of Yugoslavians and household income with householder between the ages 45 and 64 in the United States with a correlation coefficient (R) of -0.357 and weighted average of $97,558. Similarly, the statistical analysis conducted on geographies consisting of 347,427,203 people shows a weak positive correlation between the proportion of Immigrants from Russia and household income with householder between the ages 45 and 64 in the United States with a correlation coefficient (R) of 0.285 and weighted average of $113,215, a difference of 16.1%.
Householder Income Ages 45 - 64 years Correlation Summary
| Measurement | Yugoslavian | Immigrants from Russia |
| Minimum | $26,989 | $26,250 |
| Maximum | $140,097 | $250,001 |
| Range | $113,108 | $223,751 |
| Mean | $85,735 | $120,532 |
| Median | $86,945 | $109,623 |
| Interquartile 25% (IQ1) | $73,466 | $89,063 |
| Interquartile 75% (IQ3) | $98,460 | $134,641 |
| Interquartile Range (IQR) | $24,994 | $45,578 |
| Standard Deviation (Sample) | $25,335 | $49,965 |
| Standard Deviation (Population) | $25,080 | $49,419 |
Similar Demographics by Householder Income Ages 45 - 64 years
Demographics Similar to Yugoslavians by Householder Income Ages 45 - 64 years
In terms of householder income ages 45 - 64 years, the demographic groups most similar to Yugoslavians are Tlingit-Haida ($97,417, a difference of 0.15%), Immigrants from Thailand ($97,400, a difference of 0.16%), Immigrants from Eritrea ($97,373, a difference of 0.19%), Immigrants from Colombia ($97,290, a difference of 0.28%), and Immigrants from Africa ($97,284, a difference of 0.28%).
| Demographics | Rating | Rank | Householder Income Ages 45 - 64 years |
| Uruguayans | 30.3 /100 | #194 | Fair $98,660 |
| Spanish | 29.2 /100 | #195 | Fair $98,554 |
| Immigrants | Eastern Africa | 28.3 /100 | #196 | Fair $98,467 |
| Puget Sound Salish | 27.0 /100 | #197 | Fair $98,340 |
| Immigrants | Iraq | 25.7 /100 | #198 | Fair $98,201 |
| Whites/Caucasians | 24.6 /100 | #199 | Fair $98,091 |
| Immigrants | Kenya | 23.5 /100 | #200 | Fair $97,964 |
| Yugoslavians | 20.0 /100 | #201 | Fair $97,558 |
| Tlingit-Haida | 18.9 /100 | #202 | Poor $97,417 |
| Immigrants | Thailand | 18.8 /100 | #203 | Poor $97,400 |
| Immigrants | Eritrea | 18.6 /100 | #204 | Poor $97,373 |
| Immigrants | Colombia | 18.0 /100 | #205 | Poor $97,290 |
| Immigrants | Africa | 17.9 /100 | #206 | Poor $97,284 |
| Ghanaians | 17.9 /100 | #207 | Poor $97,277 |
| Scotch-Irish | 16.4 /100 | #208 | Poor $97,073 |
Demographics Similar to Immigrants from Russia by Householder Income Ages 45 - 64 years
In terms of householder income ages 45 - 64 years, the demographic groups most similar to Immigrants from Russia are Immigrants from Austria ($113,140, a difference of 0.070%), Immigrants from Indonesia ($113,519, a difference of 0.27%), Australian ($113,533, a difference of 0.28%), Immigrants from Greece ($113,548, a difference of 0.29%), and Immigrants from South Africa ($112,886, a difference of 0.29%).
| Demographics | Rating | Rank | Householder Income Ages 45 - 64 years |
| Estonians | 99.9 /100 | #42 | Exceptional $114,220 |
| Israelis | 99.9 /100 | #43 | Exceptional $114,186 |
| Bulgarians | 99.9 /100 | #44 | Exceptional $113,883 |
| Immigrants | France | 99.9 /100 | #45 | Exceptional $113,680 |
| Immigrants | Greece | 99.9 /100 | #46 | Exceptional $113,548 |
| Australians | 99.9 /100 | #47 | Exceptional $113,533 |
| Immigrants | Indonesia | 99.9 /100 | #48 | Exceptional $113,519 |
| Immigrants | Russia | 99.8 /100 | #49 | Exceptional $113,215 |
| Immigrants | Austria | 99.8 /100 | #50 | Exceptional $113,140 |
| Immigrants | South Africa | 99.8 /100 | #51 | Exceptional $112,886 |
| Immigrants | Malaysia | 99.8 /100 | #52 | Exceptional $112,796 |
| Afghans | 99.8 /100 | #53 | Exceptional $112,676 |
| Greeks | 99.8 /100 | #54 | Exceptional $112,630 |
| Lithuanians | 99.8 /100 | #55 | Exceptional $112,484 |
| Egyptians | 99.7 /100 | #56 | Exceptional $112,256 |