Yugoslavian vs Immigrants from Russia Male Unemployment
COMPARE
Yugoslavian
Immigrants from Russia
Male Unemployment
Male Unemployment Comparison
Yugoslavians
Immigrants from Russia
5.0%
MALE UNEMPLOYMENT
98.7/ 100
METRIC RATING
54th/ 347
METRIC RANK
5.3%
MALE UNEMPLOYMENT
50.7/ 100
METRIC RATING
173rd/ 347
METRIC RANK
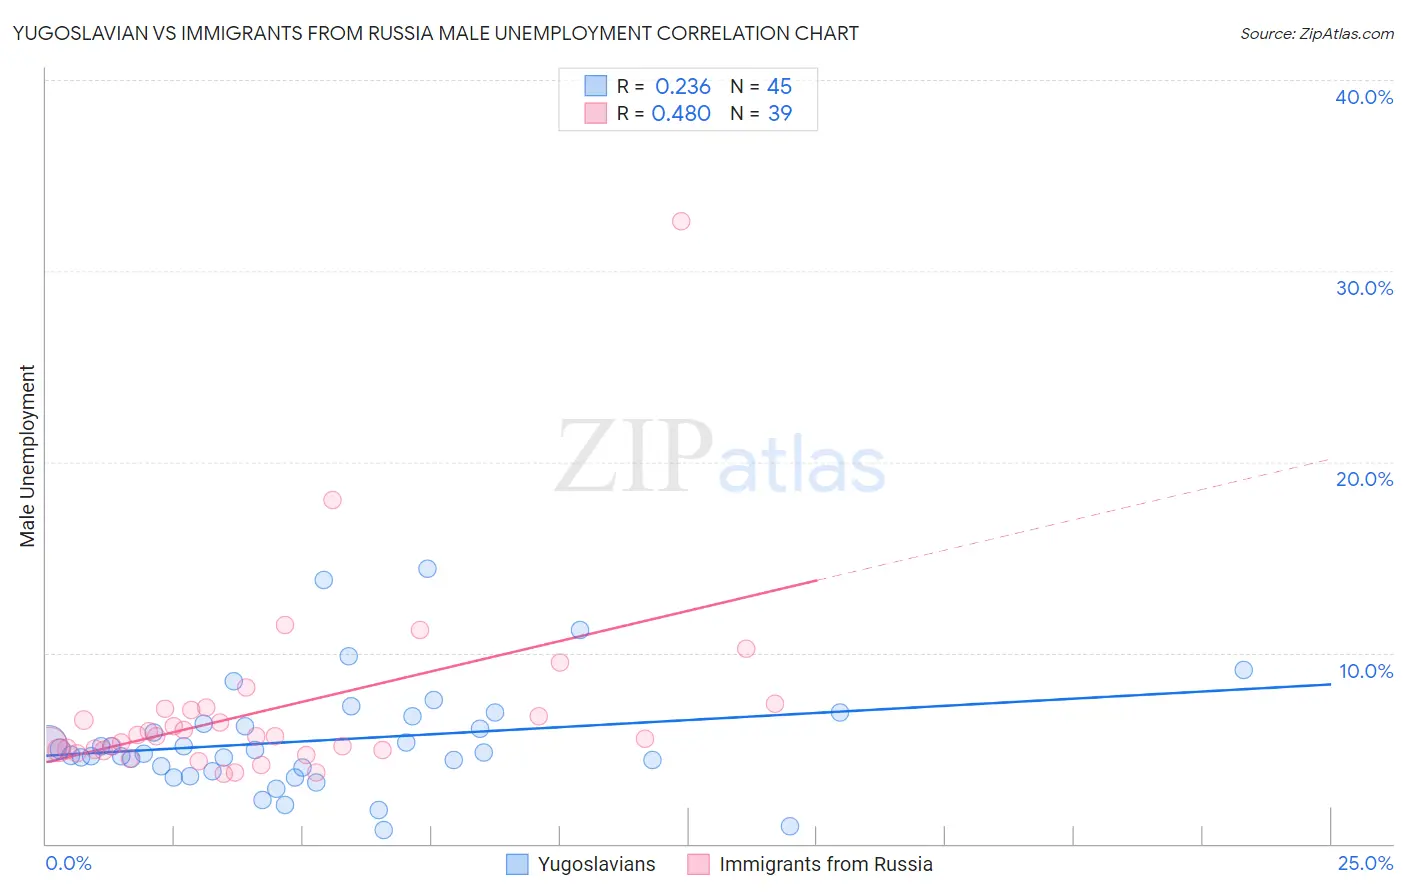
Yugoslavian vs Immigrants from Russia Male Unemployment Correlation Chart
The statistical analysis conducted on geographies consisting of 284,881,859 people shows a weak positive correlation between the proportion of Yugoslavians and unemployment rate among males in the United States with a correlation coefficient (R) of 0.236 and weighted average of 5.0%. Similarly, the statistical analysis conducted on geographies consisting of 346,725,771 people shows a moderate positive correlation between the proportion of Immigrants from Russia and unemployment rate among males in the United States with a correlation coefficient (R) of 0.480 and weighted average of 5.3%, a difference of 6.7%.
Male Unemployment Correlation Summary
| Measurement | Yugoslavian | Immigrants from Russia |
| Minimum | 0.70% | 3.7% |
| Maximum | 14.4% | 32.6% |
| Range | 13.7% | 28.9% |
| Mean | 5.4% | 7.0% |
| Median | 4.8% | 5.6% |
| Interquartile 25% (IQ1) | 3.9% | 4.9% |
| Interquartile 75% (IQ3) | 6.5% | 7.1% |
| Interquartile Range (IQR) | 2.6% | 2.2% |
| Standard Deviation (Sample) | 2.8% | 5.0% |
| Standard Deviation (Population) | 2.8% | 4.9% |
Similar Demographics by Male Unemployment
Demographics Similar to Yugoslavians by Male Unemployment
In terms of male unemployment, the demographic groups most similar to Yugoslavians are Czechoslovakian (5.0%, a difference of 0.0%), Immigrants from Bulgaria (5.0%, a difference of 0.010%), Jordanian (5.0%, a difference of 0.10%), Irish (5.0%, a difference of 0.16%), and Slovene (5.0%, a difference of 0.18%).
| Demographics | Rating | Rank | Male Unemployment |
| Austrians | 98.9 /100 | #47 | Exceptional 4.9% |
| Immigrants | Scotland | 98.9 /100 | #48 | Exceptional 4.9% |
| Poles | 98.9 /100 | #49 | Exceptional 4.9% |
| Croatians | 98.9 /100 | #50 | Exceptional 4.9% |
| Slovenes | 98.8 /100 | #51 | Exceptional 5.0% |
| Irish | 98.8 /100 | #52 | Exceptional 5.0% |
| Jordanians | 98.8 /100 | #53 | Exceptional 5.0% |
| Yugoslavians | 98.7 /100 | #54 | Exceptional 5.0% |
| Czechoslovakians | 98.7 /100 | #55 | Exceptional 5.0% |
| Immigrants | Bulgaria | 98.7 /100 | #56 | Exceptional 5.0% |
| Turks | 98.5 /100 | #57 | Exceptional 5.0% |
| Lithuanians | 98.5 /100 | #58 | Exceptional 5.0% |
| Immigrants | Netherlands | 98.3 /100 | #59 | Exceptional 5.0% |
| Immigrants | Argentina | 98.1 /100 | #60 | Exceptional 5.0% |
| Cambodians | 98.1 /100 | #61 | Exceptional 5.0% |
Demographics Similar to Immigrants from Russia by Male Unemployment
In terms of male unemployment, the demographic groups most similar to Immigrants from Russia are Immigrants from Kazakhstan (5.3%, a difference of 0.010%), Immigrants from Iran (5.3%, a difference of 0.040%), Peruvian (5.3%, a difference of 0.070%), Immigrants from Iraq (5.3%, a difference of 0.15%), and Immigrants from Eastern Europe (5.3%, a difference of 0.20%).
| Demographics | Rating | Rank | Male Unemployment |
| Immigrants | Morocco | 60.2 /100 | #166 | Good 5.3% |
| Immigrants | Vietnam | 58.1 /100 | #167 | Average 5.3% |
| Immigrants | Ireland | 57.7 /100 | #168 | Average 5.3% |
| Immigrants | Congo | 57.4 /100 | #169 | Average 5.3% |
| Immigrants | Eastern Europe | 54.1 /100 | #170 | Average 5.3% |
| Peruvians | 51.9 /100 | #171 | Average 5.3% |
| Immigrants | Kazakhstan | 50.8 /100 | #172 | Average 5.3% |
| Immigrants | Russia | 50.7 /100 | #173 | Average 5.3% |
| Immigrants | Iran | 50.0 /100 | #174 | Average 5.3% |
| Immigrants | Iraq | 48.1 /100 | #175 | Average 5.3% |
| Immigrants | Poland | 46.0 /100 | #176 | Average 5.3% |
| Immigrants | Peru | 44.6 /100 | #177 | Average 5.3% |
| Osage | 42.5 /100 | #178 | Average 5.3% |
| Immigrants | Oceania | 40.8 /100 | #179 | Average 5.3% |
| Malaysians | 39.6 /100 | #180 | Fair 5.3% |