Yugoslavian vs Immigrants from Russia Average Family Size
COMPARE
Yugoslavian
Immigrants from Russia
Average Family Size
Average Family Size Comparison
Yugoslavians
Immigrants from Russia
3.15
AVERAGE FAMILY SIZE
0.4/ 100
METRIC RATING
282nd/ 347
METRIC RANK
3.16
AVERAGE FAMILY SIZE
1.3/ 100
METRIC RATING
262nd/ 347
METRIC RANK
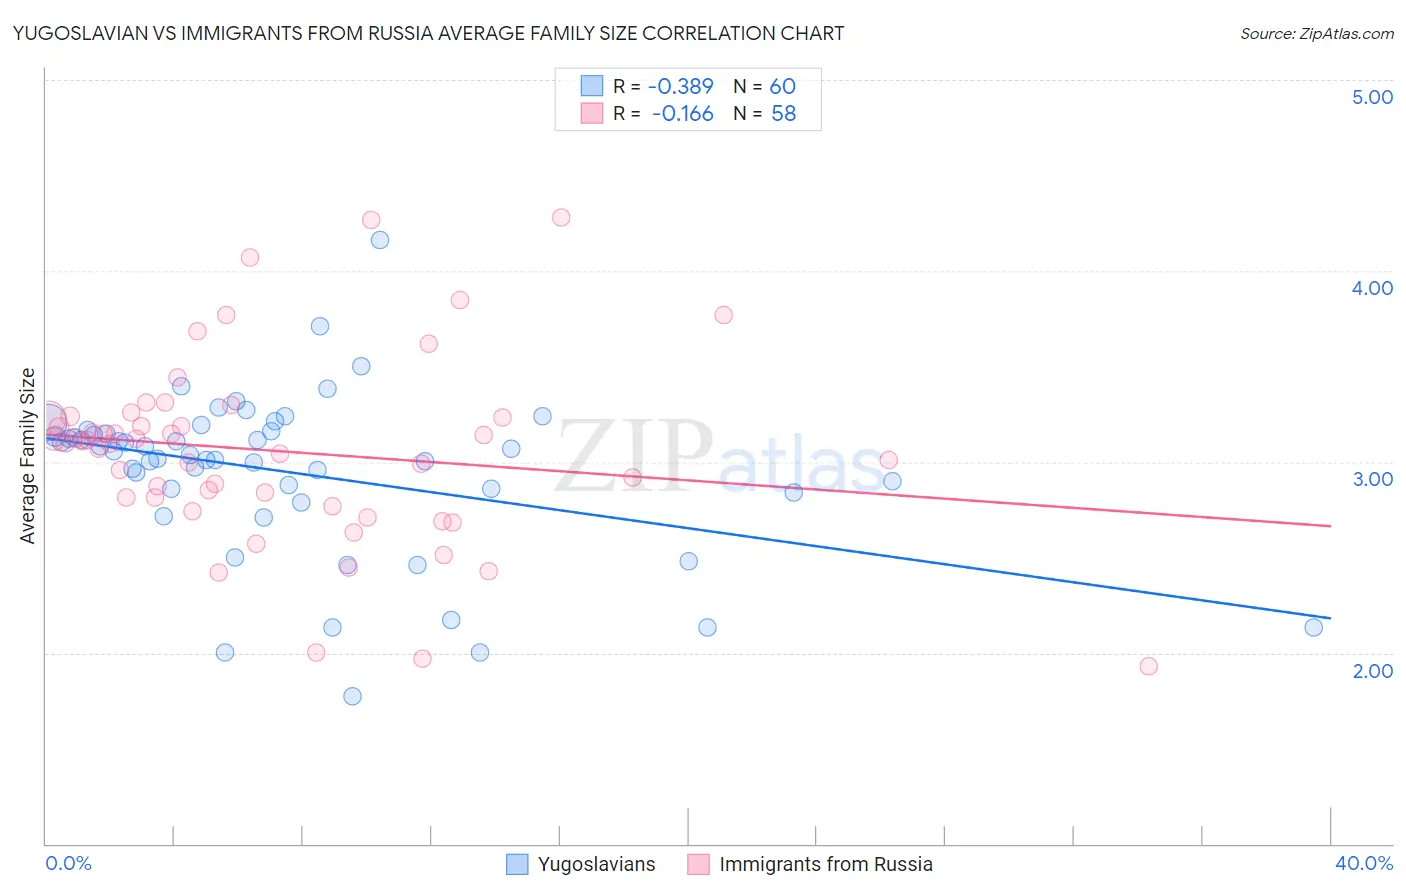
Yugoslavian vs Immigrants from Russia Average Family Size Correlation Chart
The statistical analysis conducted on geographies consisting of 285,640,029 people shows a mild negative correlation between the proportion of Yugoslavians and average family size in the United States with a correlation coefficient (R) of -0.389 and weighted average of 3.15. Similarly, the statistical analysis conducted on geographies consisting of 347,722,348 people shows a poor negative correlation between the proportion of Immigrants from Russia and average family size in the United States with a correlation coefficient (R) of -0.166 and weighted average of 3.16, a difference of 0.55%.
Average Family Size Correlation Summary
| Measurement | Yugoslavian | Immigrants from Russia |
| Minimum | 1.77 | 1.93 |
| Maximum | 4.16 | 4.28 |
| Range | 2.39 | 2.35 |
| Mean | 2.95 | 3.06 |
| Median | 3.05 | 3.10 |
| Interquartile 25% (IQ1) | 2.85 | 2.81 |
| Interquartile 75% (IQ3) | 3.15 | 3.23 |
| Interquartile Range (IQR) | 0.30 | 0.42 |
| Standard Deviation (Sample) | 0.43 | 0.48 |
| Standard Deviation (Population) | 0.43 | 0.48 |
Demographics Similar to Yugoslavians and Immigrants from Russia by Average Family Size
In terms of average family size, the demographic groups most similar to Yugoslavians are Immigrants from Denmark (3.15, a difference of 0.010%), Immigrants from England (3.15, a difference of 0.040%), Immigrants from Europe (3.15, a difference of 0.070%), Okinawan (3.15, a difference of 0.090%), and Swiss (3.15, a difference of 0.12%). Similarly, the demographic groups most similar to Immigrants from Russia are Immigrants from Bulgaria (3.16, a difference of 0.10%), American (3.16, a difference of 0.11%), Immigrants from South Africa (3.16, a difference of 0.16%), Immigrants from Greece (3.16, a difference of 0.18%), and Iroquois (3.16, a difference of 0.20%).
| Demographics | Rating | Rank | Average Family Size |
| Immigrants | Russia | 1.3 /100 | #262 | Tragic 3.16 |
| Immigrants | Bulgaria | 1.0 /100 | #263 | Tragic 3.16 |
| Americans | 1.0 /100 | #264 | Tragic 3.16 |
| Immigrants | South Africa | 0.9 /100 | #265 | Tragic 3.16 |
| Immigrants | Greece | 0.9 /100 | #266 | Tragic 3.16 |
| Iroquois | 0.8 /100 | #267 | Tragic 3.16 |
| Maltese | 0.8 /100 | #268 | Tragic 3.16 |
| Immigrants | Singapore | 0.7 /100 | #269 | Tragic 3.16 |
| Tlingit-Haida | 0.7 /100 | #270 | Tragic 3.16 |
| Immigrants | Germany | 0.7 /100 | #271 | Tragic 3.15 |
| Immigrants | Lithuania | 0.6 /100 | #272 | Tragic 3.15 |
| New Zealanders | 0.6 /100 | #273 | Tragic 3.15 |
| Immigrants | Belgium | 0.6 /100 | #274 | Tragic 3.15 |
| Cambodians | 0.6 /100 | #275 | Tragic 3.15 |
| Immigrants | Bosnia and Herzegovina | 0.5 /100 | #276 | Tragic 3.15 |
| Swiss | 0.5 /100 | #277 | Tragic 3.15 |
| Okinawans | 0.5 /100 | #278 | Tragic 3.15 |
| Immigrants | Europe | 0.5 /100 | #279 | Tragic 3.15 |
| Immigrants | England | 0.4 /100 | #280 | Tragic 3.15 |
| Immigrants | Denmark | 0.4 /100 | #281 | Tragic 3.15 |
| Yugoslavians | 0.4 /100 | #282 | Tragic 3.15 |