White/Caucasian vs Immigrants from Russia 2 or more Vehicles in Household
COMPARE
White/Caucasian
Immigrants from Russia
2 or more Vehicles in Household
2 or more Vehicles in Household Comparison
Whites/Caucasians
Immigrants from Russia
60.8%
2 OR MORE VEHICLES IN HOUSEHOLD
100.0/ 100
METRIC RATING
25th/ 347
METRIC RANK
50.3%
2 OR MORE VEHICLES IN HOUSEHOLD
0.0/ 100
METRIC RATING
300th/ 347
METRIC RANK
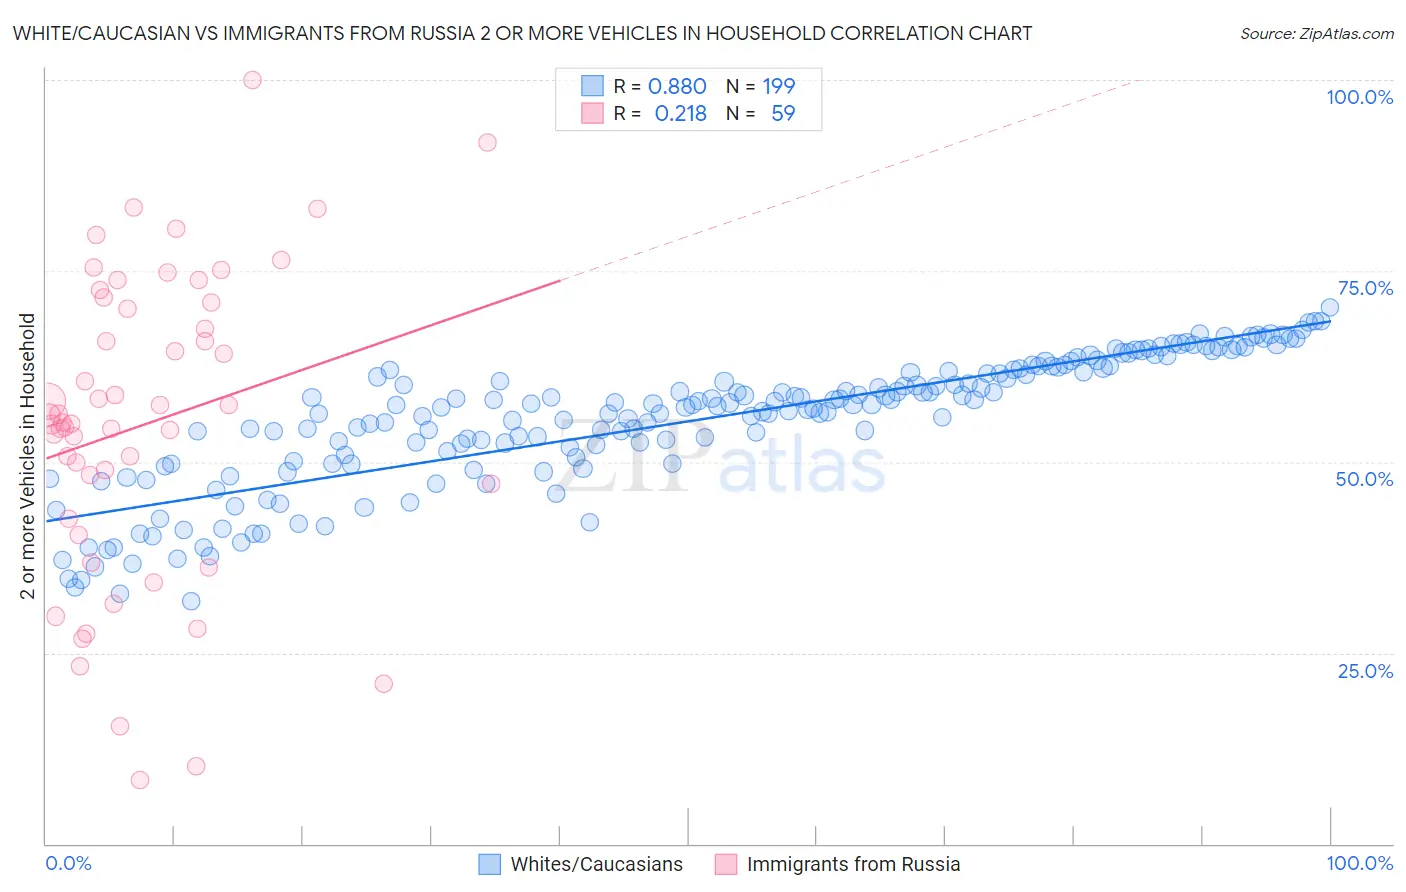
White/Caucasian vs Immigrants from Russia 2 or more Vehicles in Household Correlation Chart
The statistical analysis conducted on geographies consisting of 571,878,025 people shows a very strong positive correlation between the proportion of Whites/Caucasians and percentage of households with 2 or more vehicles available in the United States with a correlation coefficient (R) of 0.880 and weighted average of 60.8%. Similarly, the statistical analysis conducted on geographies consisting of 347,736,627 people shows a weak positive correlation between the proportion of Immigrants from Russia and percentage of households with 2 or more vehicles available in the United States with a correlation coefficient (R) of 0.218 and weighted average of 50.3%, a difference of 20.9%.
2 or more Vehicles in Household Correlation Summary
| Measurement | White/Caucasian | Immigrants from Russia |
| Minimum | 31.8% | 8.3% |
| Maximum | 70.2% | 100.0% |
| Range | 38.4% | 91.7% |
| Mean | 55.3% | 54.9% |
| Median | 57.5% | 55.2% |
| Interquartile 25% (IQ1) | 50.1% | 42.6% |
| Interquartile 75% (IQ3) | 61.9% | 70.9% |
| Interquartile Range (IQR) | 11.8% | 28.3% |
| Standard Deviation (Sample) | 8.6% | 20.1% |
| Standard Deviation (Population) | 8.6% | 19.9% |
Similar Demographics by 2 or more Vehicles in Household
Demographics Similar to Whites/Caucasians by 2 or more Vehicles in Household
In terms of 2 or more vehicles in household, the demographic groups most similar to Whites/Caucasians are Welsh (60.8%, a difference of 0.050%), Immigrants from Vietnam (60.9%, a difference of 0.15%), Scotch-Irish (60.9%, a difference of 0.19%), Swiss (61.0%, a difference of 0.23%), and Korean (61.0%, a difference of 0.26%).
| Demographics | Rating | Rank | 2 or more Vehicles in Household |
| Europeans | 100.0 /100 | #18 | Exceptional 61.4% |
| Scottish | 100.0 /100 | #19 | Exceptional 61.2% |
| Sri Lankans | 100.0 /100 | #20 | Exceptional 61.0% |
| Koreans | 100.0 /100 | #21 | Exceptional 61.0% |
| Swiss | 100.0 /100 | #22 | Exceptional 61.0% |
| Scotch-Irish | 100.0 /100 | #23 | Exceptional 60.9% |
| Immigrants | Vietnam | 100.0 /100 | #24 | Exceptional 60.9% |
| Whites/Caucasians | 100.0 /100 | #25 | Exceptional 60.8% |
| Welsh | 100.0 /100 | #26 | Exceptional 60.8% |
| Assyrians/Chaldeans/Syriacs | 100.0 /100 | #27 | Exceptional 60.5% |
| Guamanians/Chamorros | 100.0 /100 | #28 | Exceptional 60.5% |
| Hawaiians | 100.0 /100 | #29 | Exceptional 60.4% |
| Finns | 100.0 /100 | #30 | Exceptional 60.3% |
| Spanish American Indians | 100.0 /100 | #31 | Exceptional 60.3% |
| Arapaho | 100.0 /100 | #32 | Exceptional 60.2% |
Demographics Similar to Immigrants from Russia by 2 or more Vehicles in Household
In terms of 2 or more vehicles in household, the demographic groups most similar to Immigrants from Russia are Immigrants from Morocco (50.3%, a difference of 0.040%), Paraguayan (50.3%, a difference of 0.070%), Immigrants from Greece (50.2%, a difference of 0.18%), Immigrants from Spain (50.4%, a difference of 0.20%), and Immigrants from South America (50.2%, a difference of 0.24%).
| Demographics | Rating | Rank | 2 or more Vehicles in Household |
| Blacks/African Americans | 0.0 /100 | #293 | Tragic 50.9% |
| Bermudans | 0.0 /100 | #294 | Tragic 50.6% |
| Cypriots | 0.0 /100 | #295 | Tragic 50.6% |
| Immigrants | Somalia | 0.0 /100 | #296 | Tragic 50.5% |
| Immigrants | Spain | 0.0 /100 | #297 | Tragic 50.4% |
| Paraguayans | 0.0 /100 | #298 | Tragic 50.3% |
| Immigrants | Morocco | 0.0 /100 | #299 | Tragic 50.3% |
| Immigrants | Russia | 0.0 /100 | #300 | Tragic 50.3% |
| Immigrants | Greece | 0.0 /100 | #301 | Tragic 50.2% |
| Immigrants | South America | 0.0 /100 | #302 | Tragic 50.2% |
| Tohono O'odham | 0.0 /100 | #303 | Tragic 50.0% |
| Immigrants | Belize | 0.0 /100 | #304 | Tragic 49.9% |
| Immigrants | Western Africa | 0.0 /100 | #305 | Tragic 49.4% |
| Immigrants | Israel | 0.0 /100 | #306 | Tragic 49.2% |
| Hopi | 0.0 /100 | #307 | Tragic 49.0% |