White/Caucasian vs Immigrants from Costa Rica Median Male Earnings
COMPARE
White/Caucasian
Immigrants from Costa Rica
Median Male Earnings
Median Male Earnings Comparison
Whites/Caucasians
Immigrants from Costa Rica
$53,925
MEDIAN MALE EARNINGS
36.5/ 100
METRIC RATING
184th/ 347
METRIC RANK
$53,237
MEDIAN MALE EARNINGS
22.6/ 100
METRIC RATING
198th/ 347
METRIC RANK
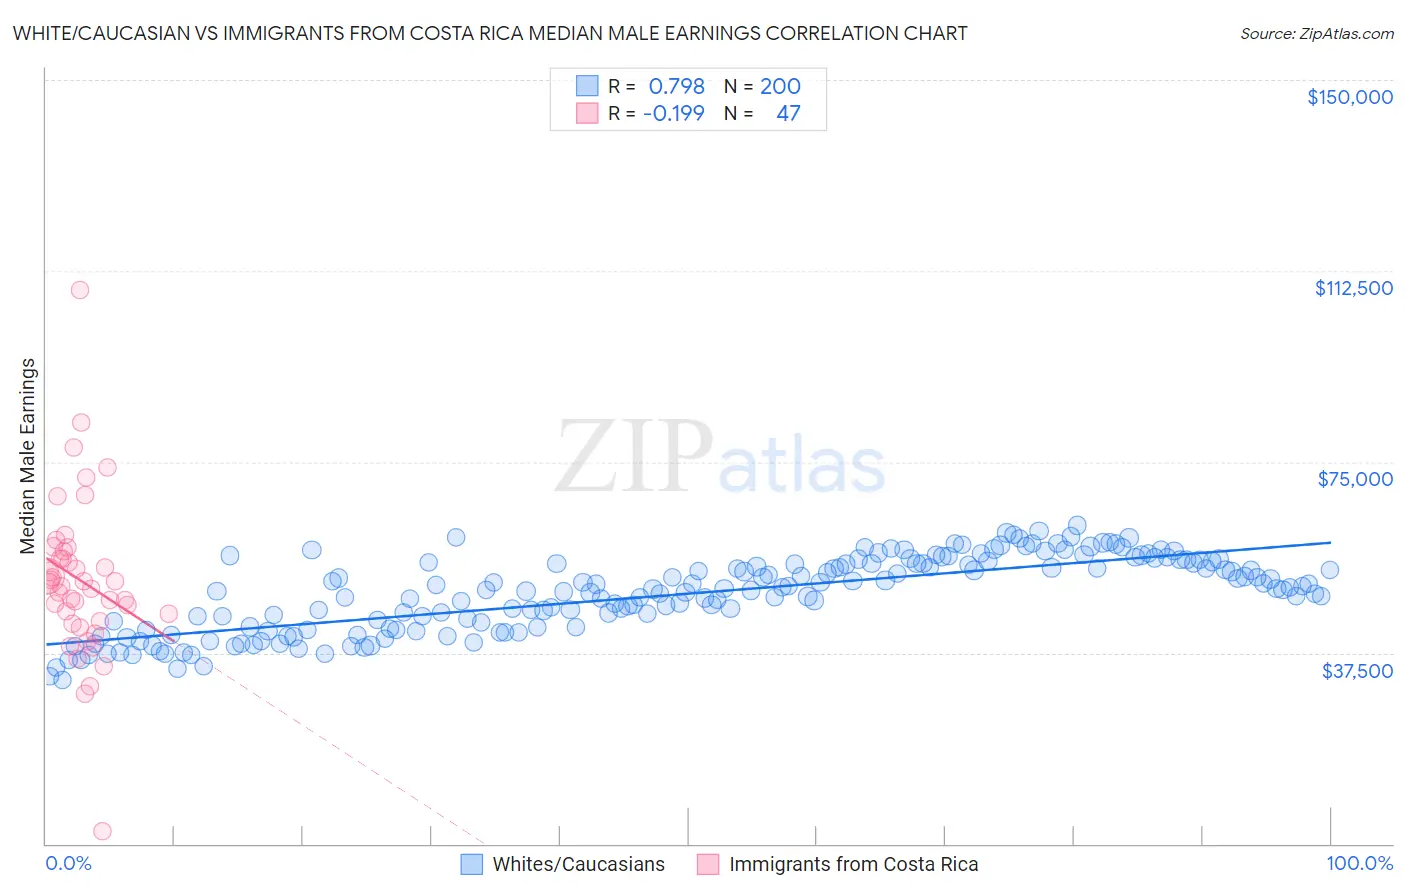
White/Caucasian vs Immigrants from Costa Rica Median Male Earnings Correlation Chart
The statistical analysis conducted on geographies consisting of 582,594,178 people shows a strong positive correlation between the proportion of Whites/Caucasians and median male earnings in the United States with a correlation coefficient (R) of 0.798 and weighted average of $53,925. Similarly, the statistical analysis conducted on geographies consisting of 204,258,977 people shows a poor negative correlation between the proportion of Immigrants from Costa Rica and median male earnings in the United States with a correlation coefficient (R) of -0.199 and weighted average of $53,237, a difference of 1.3%.
Median Male Earnings Correlation Summary
| Measurement | White/Caucasian | Immigrants from Costa Rica |
| Minimum | $32,128 | $2,499 |
| Maximum | $62,517 | $108,694 |
| Range | $30,389 | $106,195 |
| Mean | $49,142 | $51,781 |
| Median | $50,057 | $51,130 |
| Interquartile 25% (IQ1) | $42,596 | $43,645 |
| Interquartile 75% (IQ3) | $55,134 | $57,328 |
| Interquartile Range (IQR) | $12,539 | $13,682 |
| Standard Deviation (Sample) | $7,259 | $15,839 |
| Standard Deviation (Population) | $7,240 | $15,669 |
Demographics Similar to Whites/Caucasians and Immigrants from Costa Rica by Median Male Earnings
In terms of median male earnings, the demographic groups most similar to Whites/Caucasians are Immigrants from Sierra Leone ($53,905, a difference of 0.040%), Immigrants from South America ($53,962, a difference of 0.070%), Yugoslavian ($53,967, a difference of 0.080%), Colombian ($53,832, a difference of 0.17%), and Immigrants from Eritrea ($53,715, a difference of 0.39%). Similarly, the demographic groups most similar to Immigrants from Costa Rica are Tongan ($53,218, a difference of 0.030%), Immigrants from Kenya ($53,427, a difference of 0.36%), Immigrants from Africa ($53,457, a difference of 0.41%), Immigrants from the Azores ($53,503, a difference of 0.50%), and Immigrants from Thailand ($52,908, a difference of 0.62%).
| Demographics | Rating | Rank | Median Male Earnings |
| Immigrants | Immigrants | 42.1 /100 | #181 | Average $54,168 |
| Yugoslavians | 37.4 /100 | #182 | Fair $53,967 |
| Immigrants | South America | 37.3 /100 | #183 | Fair $53,962 |
| Whites/Caucasians | 36.5 /100 | #184 | Fair $53,925 |
| Immigrants | Sierra Leone | 36.0 /100 | #185 | Fair $53,905 |
| Colombians | 34.4 /100 | #186 | Fair $53,832 |
| Immigrants | Eritrea | 31.8 /100 | #187 | Fair $53,715 |
| Immigrants | Eastern Africa | 31.8 /100 | #188 | Fair $53,713 |
| Puget Sound Salish | 31.6 /100 | #189 | Fair $53,704 |
| Uruguayans | 31.1 /100 | #190 | Fair $53,680 |
| Guamanians/Chamorros | 30.7 /100 | #191 | Fair $53,661 |
| Scotch-Irish | 30.6 /100 | #192 | Fair $53,658 |
| Kenyans | 30.4 /100 | #193 | Fair $53,647 |
| Spanish | 29.0 /100 | #194 | Fair $53,576 |
| Immigrants | Azores | 27.5 /100 | #195 | Fair $53,503 |
| Immigrants | Africa | 26.6 /100 | #196 | Fair $53,457 |
| Immigrants | Kenya | 26.0 /100 | #197 | Fair $53,427 |
| Immigrants | Costa Rica | 22.6 /100 | #198 | Fair $53,237 |
| Tongans | 22.3 /100 | #199 | Fair $53,218 |
| Immigrants | Thailand | 17.5 /100 | #200 | Poor $52,908 |
| Immigrants | Bosnia and Herzegovina | 16.9 /100 | #201 | Poor $52,869 |