White/Caucasian vs Samoan 3 or more Vehicles in Household
COMPARE
White/Caucasian
Samoan
3 or more Vehicles in Household
3 or more Vehicles in Household Comparison
Whites/Caucasians
Samoans
22.6%
3 OR MORE VEHICLES IN HOUSEHOLD
100.0/ 100
METRIC RATING
51st/ 347
METRIC RANK
25.0%
3 OR MORE VEHICLES IN HOUSEHOLD
100.0/ 100
METRIC RATING
8th/ 347
METRIC RANK
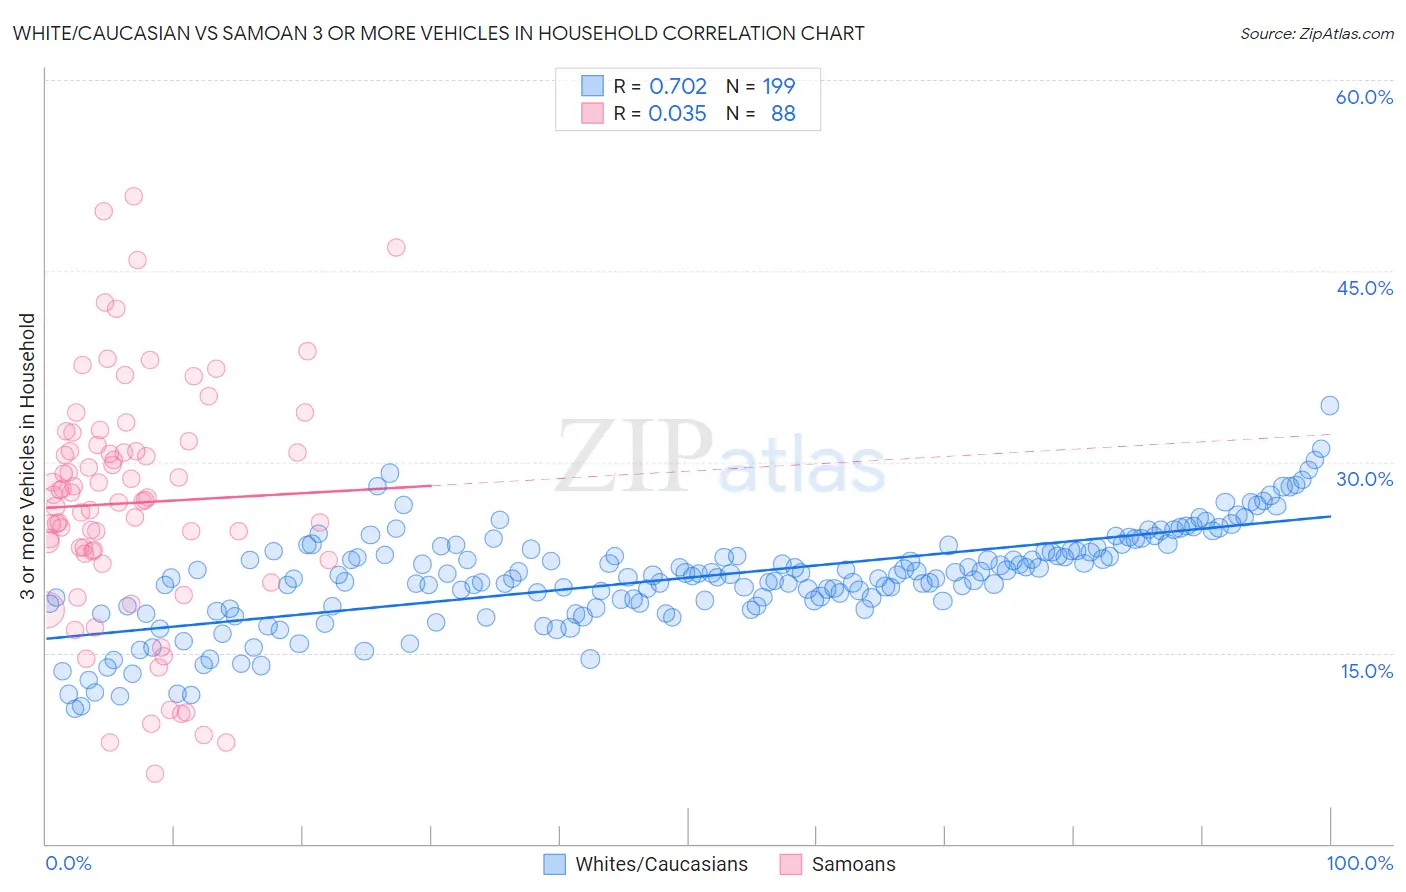
White/Caucasian vs Samoan 3 or more Vehicles in Household Correlation Chart
The statistical analysis conducted on geographies consisting of 571,274,380 people shows a strong positive correlation between the proportion of Whites/Caucasians and percentage of households with 3 or more vehicles available in the United States with a correlation coefficient (R) of 0.702 and weighted average of 22.6%. Similarly, the statistical analysis conducted on geographies consisting of 225,062,893 people shows no correlation between the proportion of Samoans and percentage of households with 3 or more vehicles available in the United States with a correlation coefficient (R) of 0.035 and weighted average of 25.0%, a difference of 10.6%.
3 or more Vehicles in Household Correlation Summary
| Measurement | White/Caucasian | Samoan |
| Minimum | 10.6% | 5.5% |
| Maximum | 34.4% | 50.9% |
| Range | 23.8% | 45.4% |
| Mean | 20.9% | 26.8% |
| Median | 21.1% | 27.1% |
| Interquartile 25% (IQ1) | 18.8% | 22.9% |
| Interquartile 75% (IQ3) | 23.1% | 31.1% |
| Interquartile Range (IQR) | 4.3% | 8.2% |
| Standard Deviation (Sample) | 4.0% | 9.3% |
| Standard Deviation (Population) | 4.0% | 9.2% |
Similar Demographics by 3 or more Vehicles in Household
Demographics Similar to Whites/Caucasians by 3 or more Vehicles in Household
In terms of 3 or more vehicles in household, the demographic groups most similar to Whites/Caucasians are Sioux (22.6%, a difference of 0.010%), Welsh (22.6%, a difference of 0.040%), Scotch-Irish (22.6%, a difference of 0.060%), Scottish (22.6%, a difference of 0.17%), and Malaysian (22.6%, a difference of 0.18%).
| Demographics | Rating | Rank | 3 or more Vehicles in Household |
| Cheyenne | 100.0 /100 | #44 | Exceptional 22.7% |
| Ute | 100.0 /100 | #45 | Exceptional 22.7% |
| Americans | 100.0 /100 | #46 | Exceptional 22.6% |
| Malaysians | 100.0 /100 | #47 | Exceptional 22.6% |
| Scottish | 100.0 /100 | #48 | Exceptional 22.6% |
| Scotch-Irish | 100.0 /100 | #49 | Exceptional 22.6% |
| Sioux | 100.0 /100 | #50 | Exceptional 22.6% |
| Whites/Caucasians | 100.0 /100 | #51 | Exceptional 22.6% |
| Welsh | 100.0 /100 | #52 | Exceptional 22.6% |
| Czechs | 100.0 /100 | #53 | Exceptional 22.5% |
| Crow | 100.0 /100 | #54 | Exceptional 22.5% |
| Immigrants | Laos | 100.0 /100 | #55 | Exceptional 22.4% |
| Hispanics or Latinos | 100.0 /100 | #56 | Exceptional 22.4% |
| Pennsylvania Germans | 100.0 /100 | #57 | Exceptional 22.3% |
| Spaniards | 100.0 /100 | #58 | Exceptional 22.3% |
Demographics Similar to Samoans by 3 or more Vehicles in Household
In terms of 3 or more vehicles in household, the demographic groups most similar to Samoans are Native Hawaiian (24.9%, a difference of 0.10%), Nepalese (24.9%, a difference of 0.19%), Shoshone (24.9%, a difference of 0.29%), Danish (24.7%, a difference of 0.98%), and Mexican (24.7%, a difference of 1.1%).
| Demographics | Rating | Rank | 3 or more Vehicles in Household |
| Yakama | 100.0 /100 | #1 | Exceptional 31.0% |
| Spanish American Indians | 100.0 /100 | #2 | Exceptional 26.9% |
| Tongans | 100.0 /100 | #3 | Exceptional 26.5% |
| Arapaho | 100.0 /100 | #4 | Exceptional 26.4% |
| Puget Sound Salish | 100.0 /100 | #5 | Exceptional 26.4% |
| Immigrants | Fiji | 100.0 /100 | #6 | Exceptional 26.1% |
| Colville | 100.0 /100 | #7 | Exceptional 25.8% |
| Samoans | 100.0 /100 | #8 | Exceptional 25.0% |
| Native Hawaiians | 100.0 /100 | #9 | Exceptional 24.9% |
| Nepalese | 100.0 /100 | #10 | Exceptional 24.9% |
| Shoshone | 100.0 /100 | #11 | Exceptional 24.9% |
| Danes | 100.0 /100 | #12 | Exceptional 24.7% |
| Mexicans | 100.0 /100 | #13 | Exceptional 24.7% |
| Immigrants | Mexico | 100.0 /100 | #14 | Exceptional 24.6% |
| Hawaiians | 100.0 /100 | #15 | Exceptional 24.3% |