Lebanese vs Filipino 3 or more Vehicles in Household
COMPARE
Lebanese
Filipino
3 or more Vehicles in Household
3 or more Vehicles in Household Comparison
Lebanese
Filipinos
20.0%
3 OR MORE VEHICLES IN HOUSEHOLD
79.8/ 100
METRIC RATING
152nd/ 347
METRIC RANK
20.8%
3 OR MORE VEHICLES IN HOUSEHOLD
97.0/ 100
METRIC RATING
109th/ 347
METRIC RANK
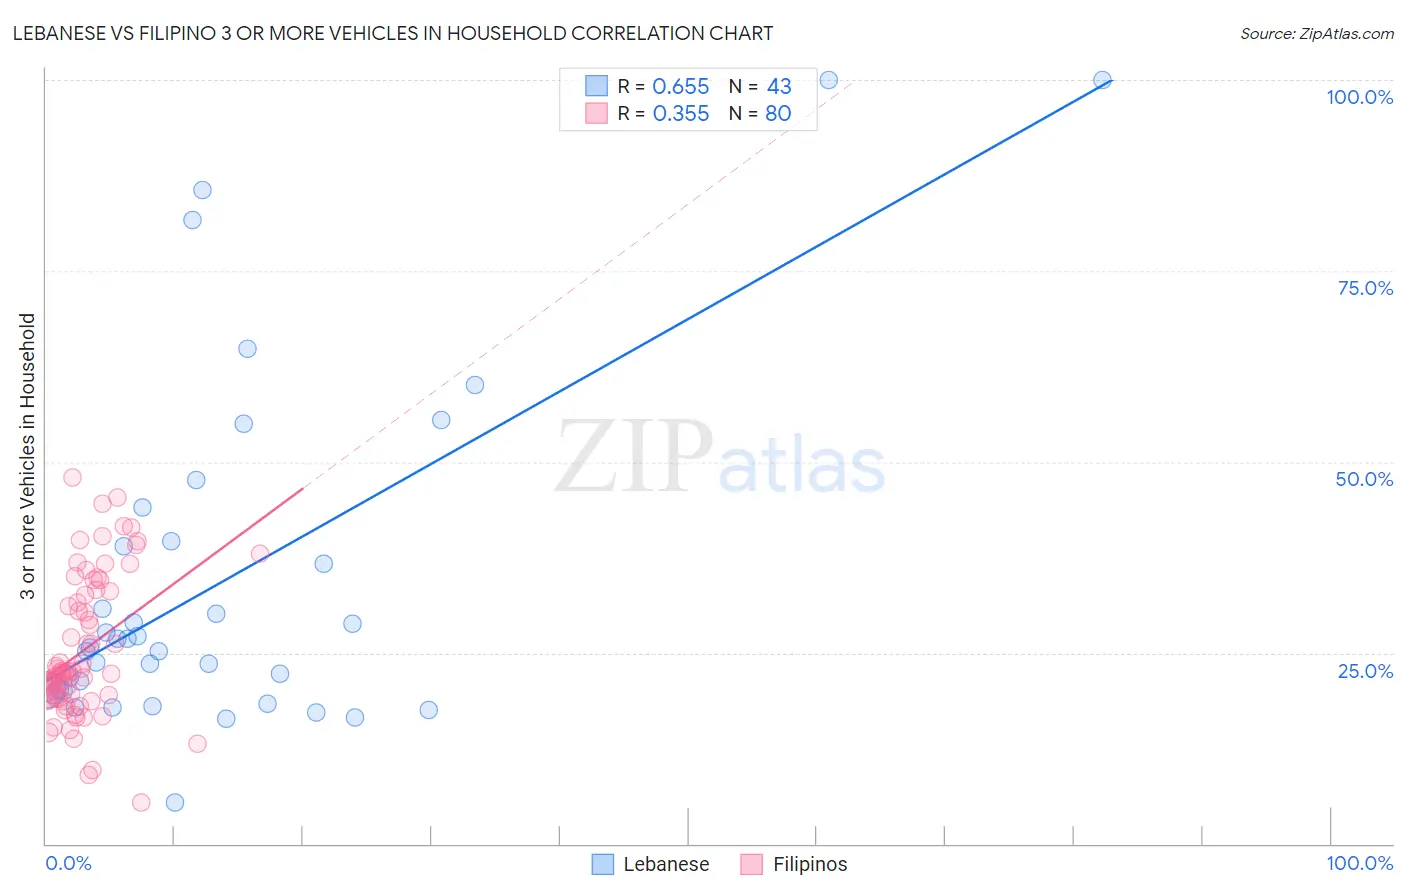
Lebanese vs Filipino 3 or more Vehicles in Household Correlation Chart
The statistical analysis conducted on geographies consisting of 401,196,452 people shows a significant positive correlation between the proportion of Lebanese and percentage of households with 3 or more vehicles available in the United States with a correlation coefficient (R) of 0.655 and weighted average of 20.0%. Similarly, the statistical analysis conducted on geographies consisting of 254,051,134 people shows a mild positive correlation between the proportion of Filipinos and percentage of households with 3 or more vehicles available in the United States with a correlation coefficient (R) of 0.355 and weighted average of 20.8%, a difference of 3.9%.
3 or more Vehicles in Household Correlation Summary
| Measurement | Lebanese | Filipino |
| Minimum | 5.4% | 5.4% |
| Maximum | 100.0% | 48.0% |
| Range | 94.6% | 42.6% |
| Mean | 34.3% | 25.3% |
| Median | 25.8% | 22.4% |
| Interquartile 25% (IQ1) | 20.0% | 19.0% |
| Interquartile 75% (IQ3) | 39.6% | 32.8% |
| Interquartile Range (IQR) | 19.7% | 13.8% |
| Standard Deviation (Sample) | 22.7% | 9.2% |
| Standard Deviation (Population) | 22.4% | 9.1% |
Similar Demographics by 3 or more Vehicles in Household
Demographics Similar to Lebanese by 3 or more Vehicles in Household
In terms of 3 or more vehicles in household, the demographic groups most similar to Lebanese are Taiwanese (20.0%, a difference of 0.10%), Immigrants (20.0%, a difference of 0.12%), Immigrants from Iran (20.0%, a difference of 0.13%), Guatemalan (20.1%, a difference of 0.34%), and Slovak (20.1%, a difference of 0.39%).
| Demographics | Rating | Rank | 3 or more Vehicles in Household |
| Palestinians | 83.9 /100 | #145 | Excellent 20.1% |
| Australians | 83.6 /100 | #146 | Excellent 20.1% |
| Slovaks | 83.0 /100 | #147 | Excellent 20.1% |
| Guatemalans | 82.6 /100 | #148 | Excellent 20.1% |
| Immigrants | Iran | 80.9 /100 | #149 | Excellent 20.0% |
| Immigrants | Immigrants | 80.8 /100 | #150 | Excellent 20.0% |
| Taiwanese | 80.6 /100 | #151 | Excellent 20.0% |
| Lebanese | 79.8 /100 | #152 | Good 20.0% |
| Yuman | 75.6 /100 | #153 | Good 19.9% |
| Immigrants | Jordan | 75.0 /100 | #154 | Good 19.9% |
| Tlingit-Haida | 73.4 /100 | #155 | Good 19.9% |
| Thais | 71.1 /100 | #156 | Good 19.8% |
| Hungarians | 70.5 /100 | #157 | Good 19.8% |
| Armenians | 68.8 /100 | #158 | Good 19.8% |
| Immigrants | Pakistan | 68.2 /100 | #159 | Good 19.8% |
Demographics Similar to Filipinos by 3 or more Vehicles in Household
In terms of 3 or more vehicles in household, the demographic groups most similar to Filipinos are Immigrants from Scotland (20.8%, a difference of 0.060%), Asian (20.8%, a difference of 0.14%), Immigrants from Micronesia (20.7%, a difference of 0.17%), Immigrants from Germany (20.8%, a difference of 0.21%), and Bolivian (20.8%, a difference of 0.25%).
| Demographics | Rating | Rank | 3 or more Vehicles in Household |
| Seminole | 97.8 /100 | #102 | Exceptional 20.9% |
| Dutch West Indians | 97.8 /100 | #103 | Exceptional 20.9% |
| Luxembourgers | 97.7 /100 | #104 | Exceptional 20.9% |
| Austrians | 97.5 /100 | #105 | Exceptional 20.9% |
| Bolivians | 97.4 /100 | #106 | Exceptional 20.8% |
| Immigrants | Germany | 97.4 /100 | #107 | Exceptional 20.8% |
| Immigrants | Scotland | 97.1 /100 | #108 | Exceptional 20.8% |
| Filipinos | 97.0 /100 | #109 | Exceptional 20.8% |
| Asians | 96.8 /100 | #110 | Exceptional 20.8% |
| Immigrants | Micronesia | 96.7 /100 | #111 | Exceptional 20.7% |
| Nicaraguans | 96.2 /100 | #112 | Exceptional 20.7% |
| Immigrants | England | 96.2 /100 | #113 | Exceptional 20.7% |
| Burmese | 95.8 /100 | #114 | Exceptional 20.6% |
| French Canadians | 95.0 /100 | #115 | Exceptional 20.6% |
| Italians | 94.9 /100 | #116 | Exceptional 20.6% |