U.S. Virgin Islander vs Immigrants from Sri Lanka 2 or more Vehicles in Household
COMPARE
U.S. Virgin Islander
Immigrants from Sri Lanka
2 or more Vehicles in Household
2 or more Vehicles in Household Comparison
U.S. Virgin Islanders
Immigrants from Sri Lanka
47.5%
2 OR MORE VEHICLES IN HOUSEHOLD
0.0/ 100
METRIC RATING
313th/ 347
METRIC RANK
55.5%
2 OR MORE VEHICLES IN HOUSEHOLD
58.3/ 100
METRIC RATING
166th/ 347
METRIC RANK
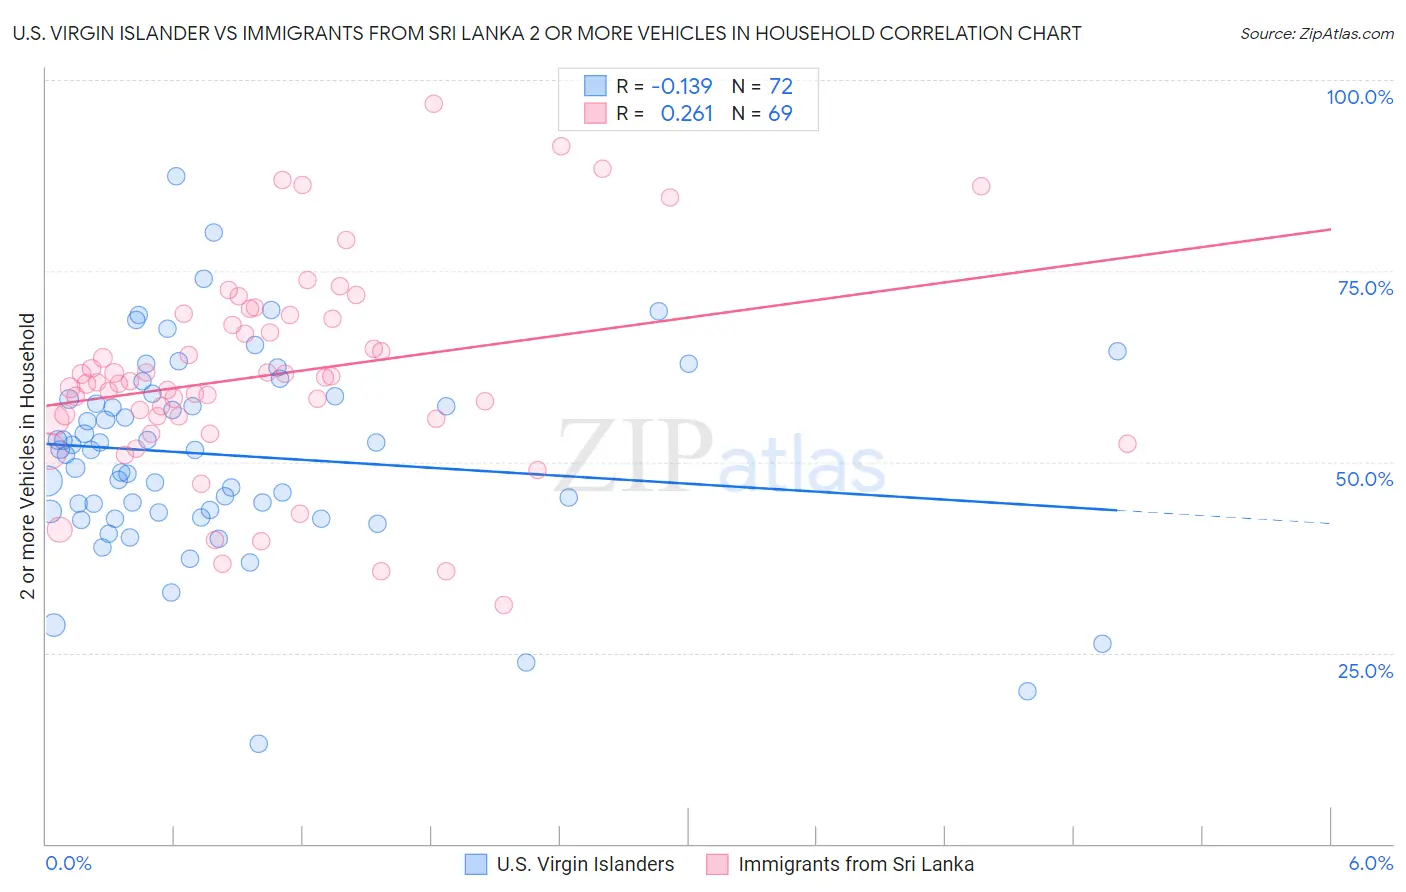
U.S. Virgin Islander vs Immigrants from Sri Lanka 2 or more Vehicles in Household Correlation Chart
The statistical analysis conducted on geographies consisting of 87,429,921 people shows a poor negative correlation between the proportion of U.S. Virgin Islanders and percentage of households with 2 or more vehicles available in the United States with a correlation coefficient (R) of -0.139 and weighted average of 47.5%. Similarly, the statistical analysis conducted on geographies consisting of 149,689,488 people shows a weak positive correlation between the proportion of Immigrants from Sri Lanka and percentage of households with 2 or more vehicles available in the United States with a correlation coefficient (R) of 0.261 and weighted average of 55.5%, a difference of 17.0%.
2 or more Vehicles in Household Correlation Summary
| Measurement | U.S. Virgin Islander | Immigrants from Sri Lanka |
| Minimum | 13.1% | 31.3% |
| Maximum | 87.3% | 96.9% |
| Range | 74.2% | 65.5% |
| Mean | 50.9% | 61.4% |
| Median | 51.5% | 60.5% |
| Interquartile 25% (IQ1) | 43.4% | 55.5% |
| Interquartile 75% (IQ3) | 58.4% | 69.0% |
| Interquartile Range (IQR) | 14.9% | 13.5% |
| Standard Deviation (Sample) | 13.1% | 13.5% |
| Standard Deviation (Population) | 13.0% | 13.4% |
Similar Demographics by 2 or more Vehicles in Household
Demographics Similar to U.S. Virgin Islanders by 2 or more Vehicles in Household
In terms of 2 or more vehicles in household, the demographic groups most similar to U.S. Virgin Islanders are Haitian (47.6%, a difference of 0.17%), Immigrants from Ghana (47.4%, a difference of 0.22%), Puerto Rican (47.1%, a difference of 0.80%), Immigrants from Belarus (47.9%, a difference of 0.91%), and Ghanaian (48.0%, a difference of 1.0%).
| Demographics | Rating | Rank | 2 or more Vehicles in Household |
| Immigrants | Israel | 0.0 /100 | #306 | Tragic 49.2% |
| Hopi | 0.0 /100 | #307 | Tragic 49.0% |
| Albanians | 0.0 /100 | #308 | Tragic 49.0% |
| Moroccans | 0.0 /100 | #309 | Tragic 48.8% |
| Ghanaians | 0.0 /100 | #310 | Tragic 48.0% |
| Immigrants | Belarus | 0.0 /100 | #311 | Tragic 47.9% |
| Haitians | 0.0 /100 | #312 | Tragic 47.6% |
| U.S. Virgin Islanders | 0.0 /100 | #313 | Tragic 47.5% |
| Immigrants | Ghana | 0.0 /100 | #314 | Tragic 47.4% |
| Puerto Ricans | 0.0 /100 | #315 | Tragic 47.1% |
| Cape Verdeans | 0.0 /100 | #316 | Tragic 46.8% |
| Immigrants | Haiti | 0.0 /100 | #317 | Tragic 46.5% |
| Immigrants | Albania | 0.0 /100 | #318 | Tragic 46.0% |
| Jamaicans | 0.0 /100 | #319 | Tragic 45.8% |
| Soviet Union | 0.0 /100 | #320 | Tragic 45.7% |
Demographics Similar to Immigrants from Sri Lanka by 2 or more Vehicles in Household
In terms of 2 or more vehicles in household, the demographic groups most similar to Immigrants from Sri Lanka are Kenyan (55.5%, a difference of 0.010%), Immigrants from El Salvador (55.6%, a difference of 0.040%), Dutch West Indian (55.6%, a difference of 0.060%), French American Indian (55.5%, a difference of 0.070%), and Immigrants from Zimbabwe (55.6%, a difference of 0.080%).
| Demographics | Rating | Rank | 2 or more Vehicles in Household |
| Paiute | 68.0 /100 | #159 | Good 55.8% |
| Crow | 67.0 /100 | #160 | Good 55.7% |
| Colville | 61.1 /100 | #161 | Good 55.6% |
| German Russians | 60.9 /100 | #162 | Good 55.6% |
| Immigrants | Zimbabwe | 60.2 /100 | #163 | Good 55.6% |
| Dutch West Indians | 59.8 /100 | #164 | Average 55.6% |
| Immigrants | El Salvador | 59.4 /100 | #165 | Average 55.6% |
| Immigrants | Sri Lanka | 58.3 /100 | #166 | Average 55.5% |
| Kenyans | 58.1 /100 | #167 | Average 55.5% |
| French American Indians | 56.7 /100 | #168 | Average 55.5% |
| Immigrants | Austria | 56.3 /100 | #169 | Average 55.5% |
| Romanians | 55.8 /100 | #170 | Average 55.5% |
| Immigrants | Costa Rica | 54.4 /100 | #171 | Average 55.4% |
| Immigrants | Nicaragua | 51.6 /100 | #172 | Average 55.4% |
| Immigrants | Western Europe | 51.4 /100 | #173 | Average 55.4% |