U.S. Virgin Islander vs Laotian 2 or more Vehicles in Household
COMPARE
U.S. Virgin Islander
Laotian
2 or more Vehicles in Household
2 or more Vehicles in Household Comparison
U.S. Virgin Islanders
Laotians
47.5%
2 OR MORE VEHICLES IN HOUSEHOLD
0.0/ 100
METRIC RATING
313th/ 347
METRIC RANK
58.6%
2 OR MORE VEHICLES IN HOUSEHOLD
99.7/ 100
METRIC RATING
67th/ 347
METRIC RANK
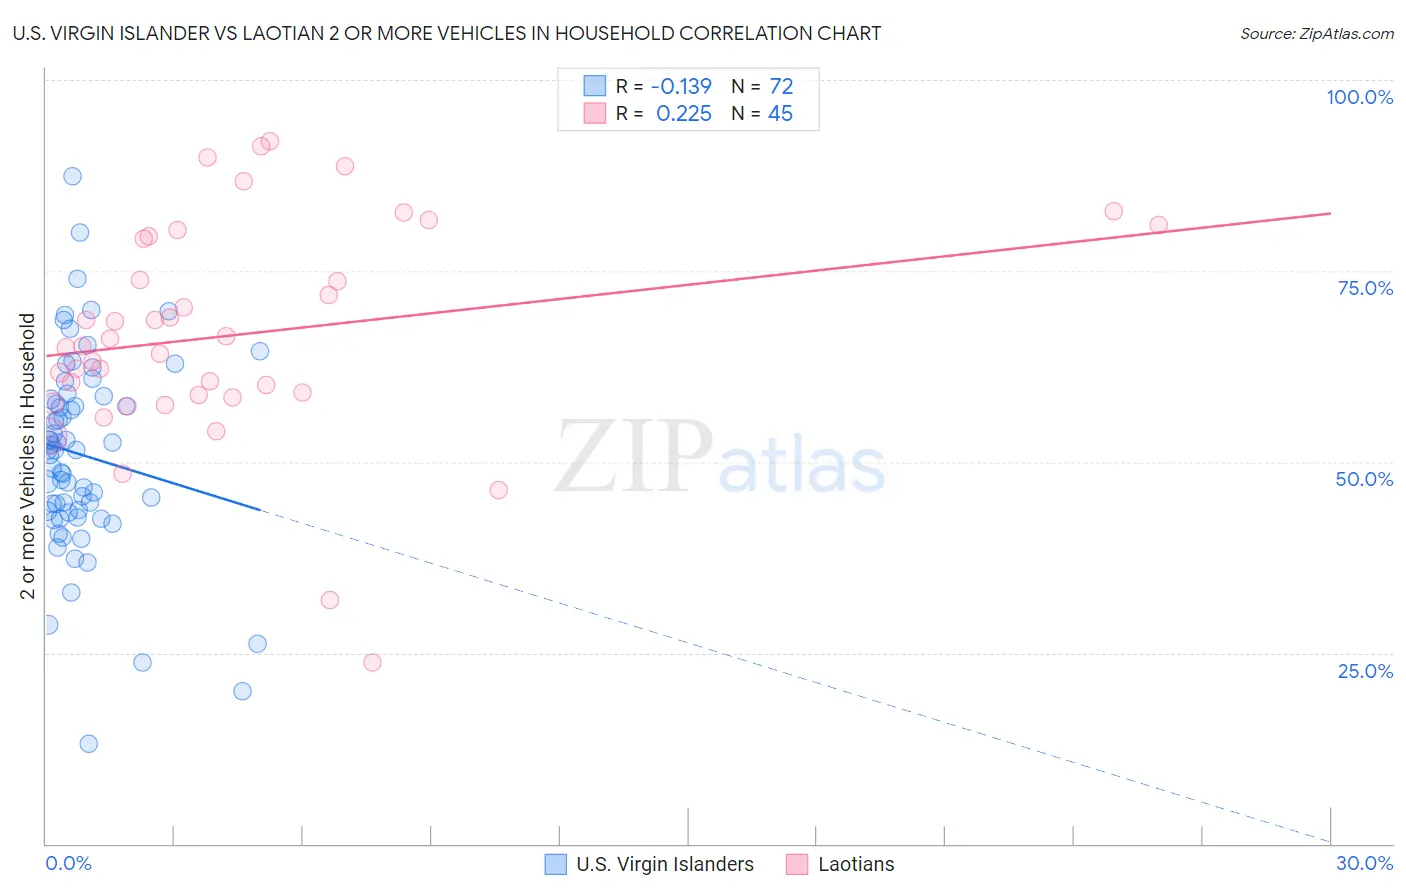
U.S. Virgin Islander vs Laotian 2 or more Vehicles in Household Correlation Chart
The statistical analysis conducted on geographies consisting of 87,429,921 people shows a poor negative correlation between the proportion of U.S. Virgin Islanders and percentage of households with 2 or more vehicles available in the United States with a correlation coefficient (R) of -0.139 and weighted average of 47.5%. Similarly, the statistical analysis conducted on geographies consisting of 224,647,130 people shows a weak positive correlation between the proportion of Laotians and percentage of households with 2 or more vehicles available in the United States with a correlation coefficient (R) of 0.225 and weighted average of 58.6%, a difference of 23.4%.
2 or more Vehicles in Household Correlation Summary
| Measurement | U.S. Virgin Islander | Laotian |
| Minimum | 13.1% | 23.7% |
| Maximum | 87.3% | 91.9% |
| Range | 74.2% | 68.2% |
| Mean | 50.9% | 66.6% |
| Median | 51.5% | 65.2% |
| Interquartile 25% (IQ1) | 43.4% | 58.6% |
| Interquartile 75% (IQ3) | 58.4% | 79.4% |
| Interquartile Range (IQR) | 14.9% | 20.8% |
| Standard Deviation (Sample) | 13.1% | 14.5% |
| Standard Deviation (Population) | 13.0% | 14.3% |
Similar Demographics by 2 or more Vehicles in Household
Demographics Similar to U.S. Virgin Islanders by 2 or more Vehicles in Household
In terms of 2 or more vehicles in household, the demographic groups most similar to U.S. Virgin Islanders are Haitian (47.6%, a difference of 0.17%), Immigrants from Ghana (47.4%, a difference of 0.22%), Puerto Rican (47.1%, a difference of 0.80%), Immigrants from Belarus (47.9%, a difference of 0.91%), and Ghanaian (48.0%, a difference of 1.0%).
| Demographics | Rating | Rank | 2 or more Vehicles in Household |
| Immigrants | Israel | 0.0 /100 | #306 | Tragic 49.2% |
| Hopi | 0.0 /100 | #307 | Tragic 49.0% |
| Albanians | 0.0 /100 | #308 | Tragic 49.0% |
| Moroccans | 0.0 /100 | #309 | Tragic 48.8% |
| Ghanaians | 0.0 /100 | #310 | Tragic 48.0% |
| Immigrants | Belarus | 0.0 /100 | #311 | Tragic 47.9% |
| Haitians | 0.0 /100 | #312 | Tragic 47.6% |
| U.S. Virgin Islanders | 0.0 /100 | #313 | Tragic 47.5% |
| Immigrants | Ghana | 0.0 /100 | #314 | Tragic 47.4% |
| Puerto Ricans | 0.0 /100 | #315 | Tragic 47.1% |
| Cape Verdeans | 0.0 /100 | #316 | Tragic 46.8% |
| Immigrants | Haiti | 0.0 /100 | #317 | Tragic 46.5% |
| Immigrants | Albania | 0.0 /100 | #318 | Tragic 46.0% |
| Jamaicans | 0.0 /100 | #319 | Tragic 45.8% |
| Soviet Union | 0.0 /100 | #320 | Tragic 45.7% |
Demographics Similar to Laotians by 2 or more Vehicles in Household
In terms of 2 or more vehicles in household, the demographic groups most similar to Laotians are Canadian (58.6%, a difference of 0.010%), Immigrants from Central America (58.6%, a difference of 0.020%), Croatian (58.6%, a difference of 0.020%), Portuguese (58.6%, a difference of 0.070%), and Pennsylvania German (58.5%, a difference of 0.13%).
| Demographics | Rating | Rank | 2 or more Vehicles in Household |
| French Canadians | 99.8 /100 | #60 | Exceptional 58.9% |
| Osage | 99.8 /100 | #61 | Exceptional 58.8% |
| Immigrants | Nonimmigrants | 99.8 /100 | #62 | Exceptional 58.8% |
| Mexican American Indians | 99.8 /100 | #63 | Exceptional 58.7% |
| Portuguese | 99.7 /100 | #64 | Exceptional 58.6% |
| Immigrants | Central America | 99.7 /100 | #65 | Exceptional 58.6% |
| Croatians | 99.7 /100 | #66 | Exceptional 58.6% |
| Laotians | 99.7 /100 | #67 | Exceptional 58.6% |
| Canadians | 99.7 /100 | #68 | Exceptional 58.6% |
| Pennsylvania Germans | 99.7 /100 | #69 | Exceptional 58.5% |
| Italians | 99.6 /100 | #70 | Exceptional 58.4% |
| Bangladeshis | 99.6 /100 | #71 | Exceptional 58.4% |
| Austrians | 99.6 /100 | #72 | Exceptional 58.4% |
| Bolivians | 99.6 /100 | #73 | Exceptional 58.3% |
| Immigrants | Afghanistan | 99.6 /100 | #74 | Exceptional 58.3% |