U.S. Virgin Islander vs Estonian In Labor Force | Age 25-29
COMPARE
U.S. Virgin Islander
Estonian
In Labor Force | Age 25-29
In Labor Force | Age 25-29 Comparison
U.S. Virgin Islanders
Estonians
83.8%
IN LABOR FORCE | AGE 25-29
0.6/ 100
METRIC RATING
242nd/ 347
METRIC RANK
85.5%
IN LABOR FORCE | AGE 25-29
99.6/ 100
METRIC RATING
57th/ 347
METRIC RANK
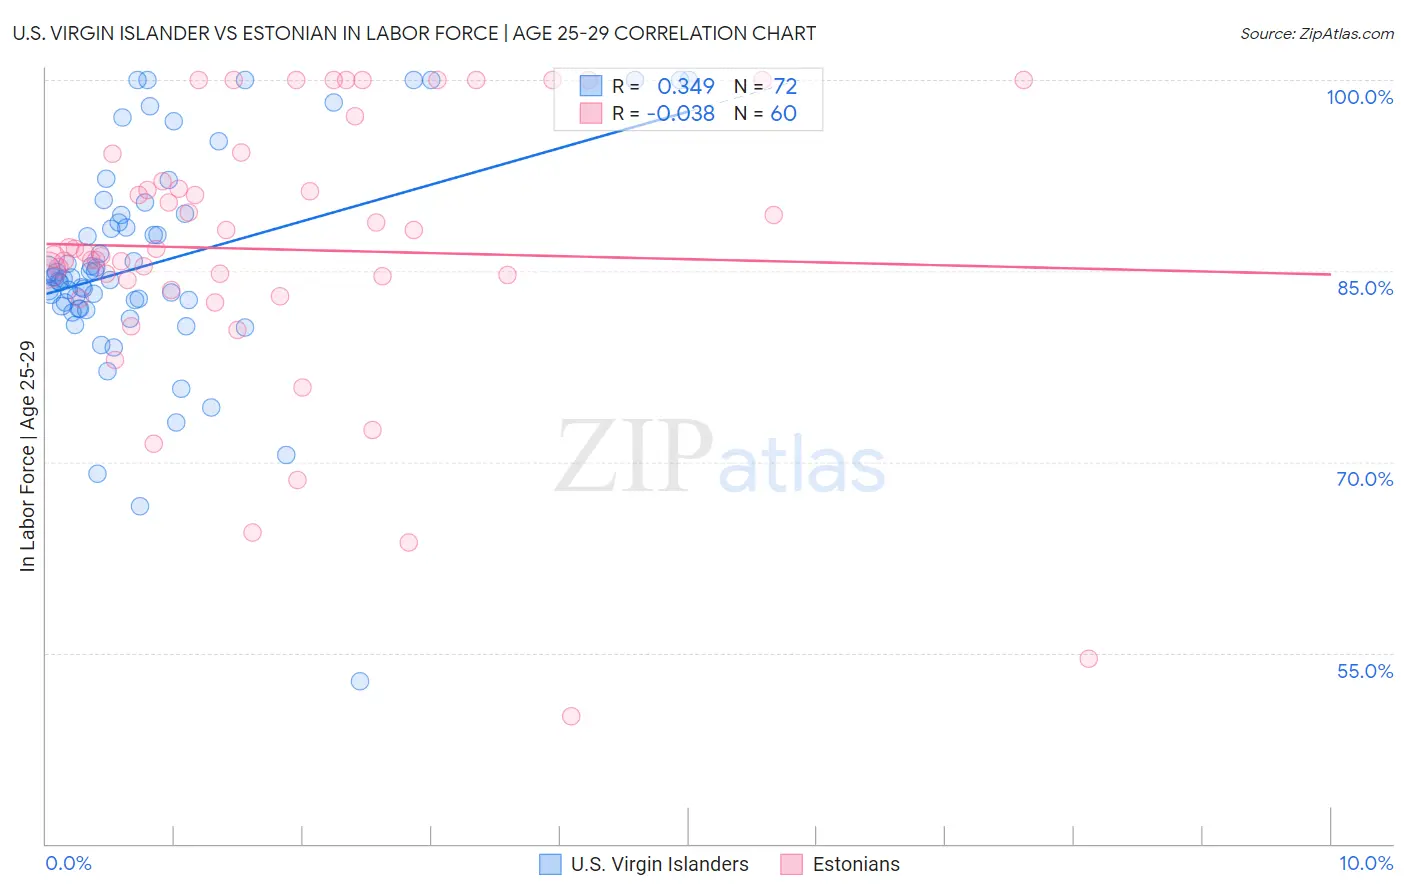
U.S. Virgin Islander vs Estonian In Labor Force | Age 25-29 Correlation Chart
The statistical analysis conducted on geographies consisting of 87,522,048 people shows a mild positive correlation between the proportion of U.S. Virgin Islanders and labor force participation rate among population between the ages 25 and 29 in the United States with a correlation coefficient (R) of 0.349 and weighted average of 83.8%. Similarly, the statistical analysis conducted on geographies consisting of 123,516,620 people shows no correlation between the proportion of Estonians and labor force participation rate among population between the ages 25 and 29 in the United States with a correlation coefficient (R) of -0.038 and weighted average of 85.5%, a difference of 2.0%.
In Labor Force | Age 25-29 Correlation Summary
| Measurement | U.S. Virgin Islander | Estonian |
| Minimum | 52.8% | 50.0% |
| Maximum | 100.0% | 100.0% |
| Range | 47.2% | 50.0% |
| Mean | 85.6% | 86.7% |
| Median | 84.5% | 86.6% |
| Interquartile 25% (IQ1) | 82.2% | 83.9% |
| Interquartile 75% (IQ3) | 89.4% | 93.1% |
| Interquartile Range (IQR) | 7.3% | 9.2% |
| Standard Deviation (Sample) | 8.6% | 10.9% |
| Standard Deviation (Population) | 8.5% | 10.8% |
Similar Demographics by In Labor Force | Age 25-29
Demographics Similar to U.S. Virgin Islanders by In Labor Force | Age 25-29
In terms of in labor force | age 25-29, the demographic groups most similar to U.S. Virgin Islanders are Salvadoran (83.8%, a difference of 0.010%), Alsatian (83.9%, a difference of 0.030%), Immigrants from Jamaica (83.8%, a difference of 0.050%), Iroquois (83.8%, a difference of 0.050%), and Immigrants from Uzbekistan (83.9%, a difference of 0.060%).
| Demographics | Rating | Rank | In Labor Force | Age 25-29 |
| Iraqis | 0.9 /100 | #235 | Tragic 83.9% |
| Guamanians/Chamorros | 0.9 /100 | #236 | Tragic 83.9% |
| Immigrants | Immigrants | 0.9 /100 | #237 | Tragic 83.9% |
| Immigrants | Uzbekistan | 0.8 /100 | #238 | Tragic 83.9% |
| Jamaicans | 0.8 /100 | #239 | Tragic 83.9% |
| Trinidadians and Tobagonians | 0.7 /100 | #240 | Tragic 83.9% |
| Alsatians | 0.7 /100 | #241 | Tragic 83.9% |
| U.S. Virgin Islanders | 0.6 /100 | #242 | Tragic 83.8% |
| Salvadorans | 0.5 /100 | #243 | Tragic 83.8% |
| Immigrants | Jamaica | 0.4 /100 | #244 | Tragic 83.8% |
| Iroquois | 0.4 /100 | #245 | Tragic 83.8% |
| Cree | 0.3 /100 | #246 | Tragic 83.8% |
| Immigrants | El Salvador | 0.3 /100 | #247 | Tragic 83.7% |
| Immigrants | Nonimmigrants | 0.3 /100 | #248 | Tragic 83.7% |
| Hmong | 0.3 /100 | #249 | Tragic 83.7% |
Demographics Similar to Estonians by In Labor Force | Age 25-29
In terms of in labor force | age 25-29, the demographic groups most similar to Estonians are Eastern European (85.5%, a difference of 0.010%), Greek (85.5%, a difference of 0.010%), Immigrants from Morocco (85.5%, a difference of 0.010%), Immigrants from Brazil (85.5%, a difference of 0.040%), and Thai (85.5%, a difference of 0.040%).
| Demographics | Rating | Rank | In Labor Force | Age 25-29 |
| Yugoslavians | 99.8 /100 | #50 | Exceptional 85.6% |
| Immigrants | Latvia | 99.8 /100 | #51 | Exceptional 85.6% |
| Immigrants | Poland | 99.7 /100 | #52 | Exceptional 85.6% |
| Belgians | 99.7 /100 | #53 | Exceptional 85.5% |
| Albanians | 99.7 /100 | #54 | Exceptional 85.5% |
| Immigrants | Brazil | 99.7 /100 | #55 | Exceptional 85.5% |
| Eastern Europeans | 99.6 /100 | #56 | Exceptional 85.5% |
| Estonians | 99.6 /100 | #57 | Exceptional 85.5% |
| Greeks | 99.6 /100 | #58 | Exceptional 85.5% |
| Immigrants | Morocco | 99.5 /100 | #59 | Exceptional 85.5% |
| Thais | 99.5 /100 | #60 | Exceptional 85.5% |
| Serbians | 99.5 /100 | #61 | Exceptional 85.5% |
| Taiwanese | 99.4 /100 | #62 | Exceptional 85.4% |
| Immigrants | Kenya | 99.4 /100 | #63 | Exceptional 85.4% |
| Immigrants | Italy | 99.3 /100 | #64 | Exceptional 85.4% |