U.S. Virgin Islander vs Turkish 2 or more Vehicles in Household
COMPARE
U.S. Virgin Islander
Turkish
2 or more Vehicles in Household
2 or more Vehicles in Household Comparison
U.S. Virgin Islanders
Turks
47.5%
2 OR MORE VEHICLES IN HOUSEHOLD
0.0/ 100
METRIC RATING
313th/ 347
METRIC RANK
54.3%
2 OR MORE VEHICLES IN HOUSEHOLD
13.0/ 100
METRIC RATING
207th/ 347
METRIC RANK
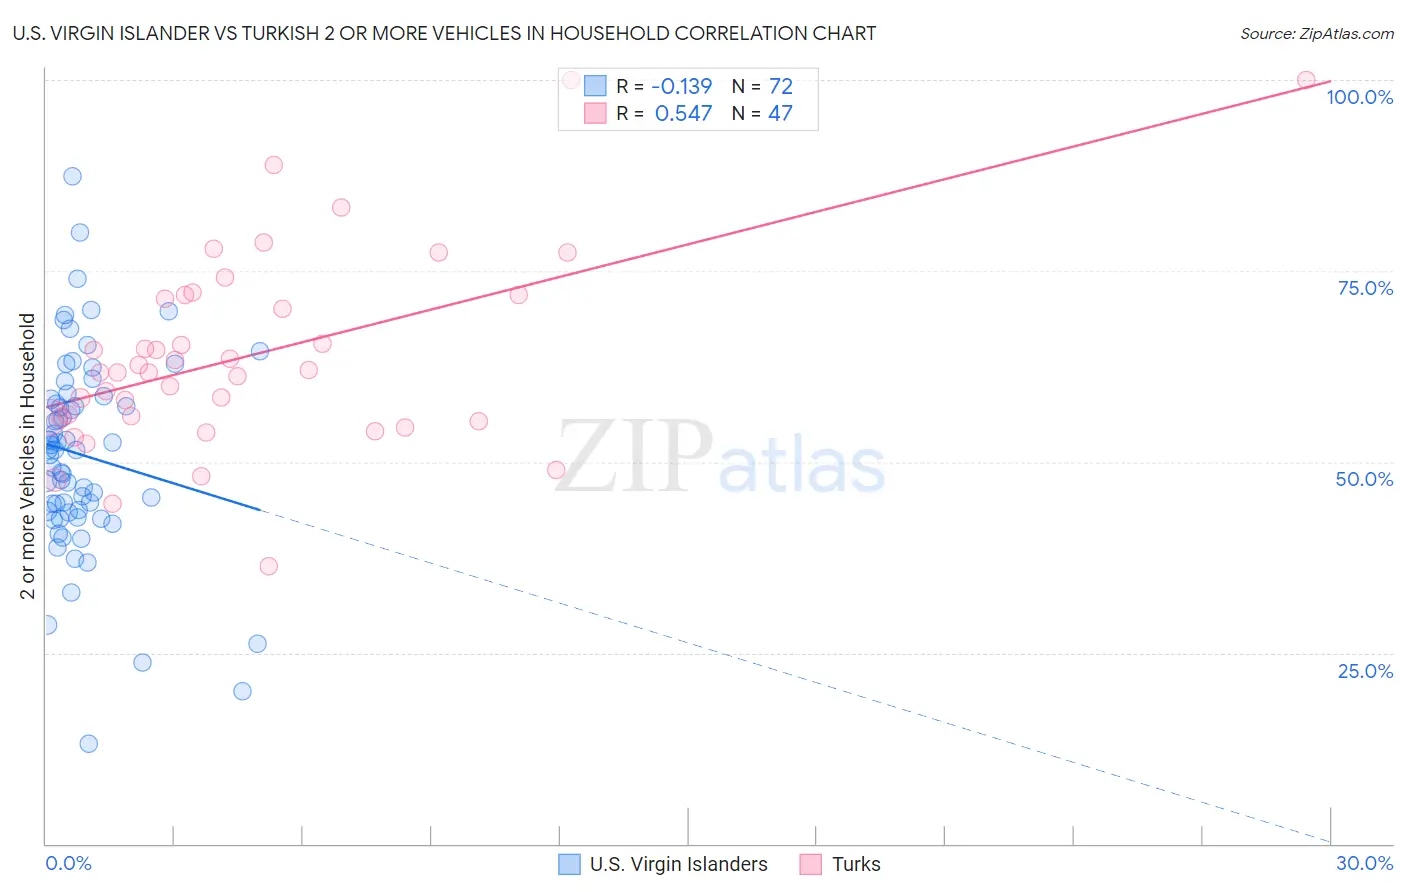
U.S. Virgin Islander vs Turkish 2 or more Vehicles in Household Correlation Chart
The statistical analysis conducted on geographies consisting of 87,429,921 people shows a poor negative correlation between the proportion of U.S. Virgin Islanders and percentage of households with 2 or more vehicles available in the United States with a correlation coefficient (R) of -0.139 and weighted average of 47.5%. Similarly, the statistical analysis conducted on geographies consisting of 271,715,533 people shows a substantial positive correlation between the proportion of Turks and percentage of households with 2 or more vehicles available in the United States with a correlation coefficient (R) of 0.547 and weighted average of 54.3%, a difference of 14.4%.
2 or more Vehicles in Household Correlation Summary
| Measurement | U.S. Virgin Islander | Turkish |
| Minimum | 13.1% | 36.3% |
| Maximum | 87.3% | 100.0% |
| Range | 74.2% | 63.7% |
| Mean | 50.9% | 63.9% |
| Median | 51.5% | 61.8% |
| Interquartile 25% (IQ1) | 43.4% | 55.8% |
| Interquartile 75% (IQ3) | 58.4% | 71.8% |
| Interquartile Range (IQR) | 14.9% | 16.0% |
| Standard Deviation (Sample) | 13.1% | 12.9% |
| Standard Deviation (Population) | 13.0% | 12.8% |
Similar Demographics by 2 or more Vehicles in Household
Demographics Similar to U.S. Virgin Islanders by 2 or more Vehicles in Household
In terms of 2 or more vehicles in household, the demographic groups most similar to U.S. Virgin Islanders are Haitian (47.6%, a difference of 0.17%), Immigrants from Ghana (47.4%, a difference of 0.22%), Puerto Rican (47.1%, a difference of 0.80%), Immigrants from Belarus (47.9%, a difference of 0.91%), and Ghanaian (48.0%, a difference of 1.0%).
| Demographics | Rating | Rank | 2 or more Vehicles in Household |
| Immigrants | Israel | 0.0 /100 | #306 | Tragic 49.2% |
| Hopi | 0.0 /100 | #307 | Tragic 49.0% |
| Albanians | 0.0 /100 | #308 | Tragic 49.0% |
| Moroccans | 0.0 /100 | #309 | Tragic 48.8% |
| Ghanaians | 0.0 /100 | #310 | Tragic 48.0% |
| Immigrants | Belarus | 0.0 /100 | #311 | Tragic 47.9% |
| Haitians | 0.0 /100 | #312 | Tragic 47.6% |
| U.S. Virgin Islanders | 0.0 /100 | #313 | Tragic 47.5% |
| Immigrants | Ghana | 0.0 /100 | #314 | Tragic 47.4% |
| Puerto Ricans | 0.0 /100 | #315 | Tragic 47.1% |
| Cape Verdeans | 0.0 /100 | #316 | Tragic 46.8% |
| Immigrants | Haiti | 0.0 /100 | #317 | Tragic 46.5% |
| Immigrants | Albania | 0.0 /100 | #318 | Tragic 46.0% |
| Jamaicans | 0.0 /100 | #319 | Tragic 45.8% |
| Soviet Union | 0.0 /100 | #320 | Tragic 45.7% |
Demographics Similar to Turks by 2 or more Vehicles in Household
In terms of 2 or more vehicles in household, the demographic groups most similar to Turks are Immigrants from Latin America (54.3%, a difference of 0.010%), Cheyenne (54.3%, a difference of 0.060%), Immigrants from Belgium (54.3%, a difference of 0.070%), Egyptian (54.3%, a difference of 0.090%), and Immigrants from Bulgaria (54.3%, a difference of 0.090%).
| Demographics | Rating | Rank | 2 or more Vehicles in Household |
| Houma | 15.8 /100 | #200 | Poor 54.4% |
| Immigrants | Italy | 15.5 /100 | #201 | Poor 54.4% |
| Immigrants | North Macedonia | 14.9 /100 | #202 | Poor 54.4% |
| Immigrants | Peru | 14.3 /100 | #203 | Poor 54.4% |
| Immigrants | Belgium | 13.7 /100 | #204 | Poor 54.3% |
| Cheyenne | 13.6 /100 | #205 | Poor 54.3% |
| Immigrants | Latin America | 13.1 /100 | #206 | Poor 54.3% |
| Turks | 13.0 /100 | #207 | Poor 54.3% |
| Egyptians | 12.0 /100 | #208 | Poor 54.3% |
| Immigrants | Bulgaria | 12.0 /100 | #209 | Poor 54.3% |
| Immigrants | Saudi Arabia | 11.3 /100 | #210 | Poor 54.2% |
| Immigrants | Hungary | 11.3 /100 | #211 | Poor 54.2% |
| Immigrants | Chile | 11.1 /100 | #212 | Poor 54.2% |
| Guatemalans | 9.6 /100 | #213 | Tragic 54.1% |
| Immigrants | Czechoslovakia | 9.4 /100 | #214 | Tragic 54.1% |