U.S. Virgin Islander vs Okinawan 2 or more Vehicles in Household
COMPARE
U.S. Virgin Islander
Okinawan
2 or more Vehicles in Household
2 or more Vehicles in Household Comparison
U.S. Virgin Islanders
Okinawans
47.5%
2 OR MORE VEHICLES IN HOUSEHOLD
0.0/ 100
METRIC RATING
313th/ 347
METRIC RANK
51.2%
2 OR MORE VEHICLES IN HOUSEHOLD
0.1/ 100
METRIC RATING
288th/ 347
METRIC RANK
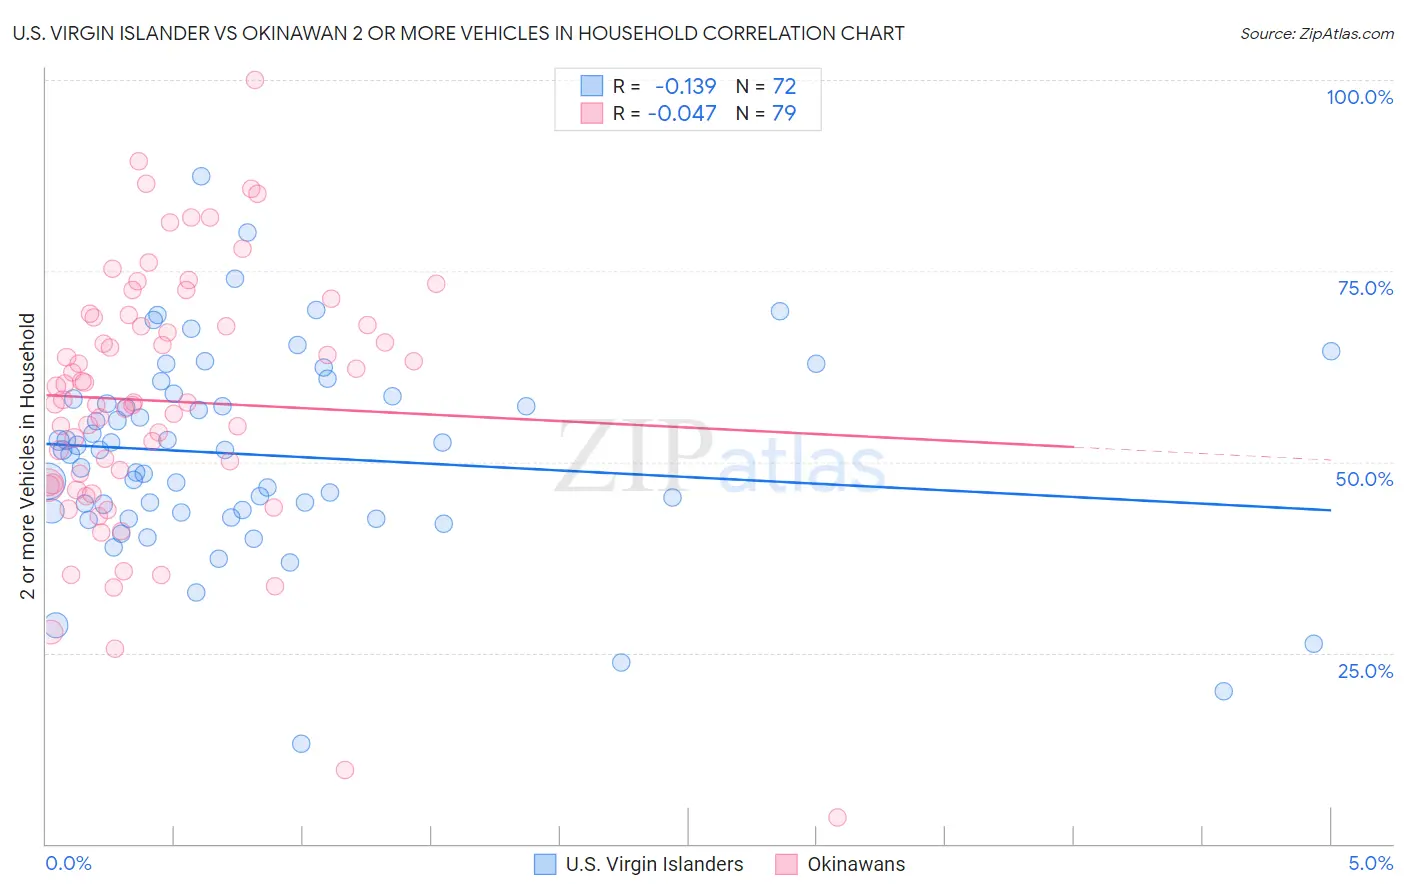
U.S. Virgin Islander vs Okinawan 2 or more Vehicles in Household Correlation Chart
The statistical analysis conducted on geographies consisting of 87,429,921 people shows a poor negative correlation between the proportion of U.S. Virgin Islanders and percentage of households with 2 or more vehicles available in the United States with a correlation coefficient (R) of -0.139 and weighted average of 47.5%. Similarly, the statistical analysis conducted on geographies consisting of 73,742,117 people shows no correlation between the proportion of Okinawans and percentage of households with 2 or more vehicles available in the United States with a correlation coefficient (R) of -0.047 and weighted average of 51.2%, a difference of 7.9%.
2 or more Vehicles in Household Correlation Summary
| Measurement | U.S. Virgin Islander | Okinawan |
| Minimum | 13.1% | 3.5% |
| Maximum | 87.3% | 100.0% |
| Range | 74.2% | 96.5% |
| Mean | 50.9% | 58.0% |
| Median | 51.5% | 57.7% |
| Interquartile 25% (IQ1) | 43.4% | 46.9% |
| Interquartile 75% (IQ3) | 58.4% | 68.9% |
| Interquartile Range (IQR) | 14.9% | 22.0% |
| Standard Deviation (Sample) | 13.1% | 17.1% |
| Standard Deviation (Population) | 13.0% | 17.0% |
Similar Demographics by 2 or more Vehicles in Household
Demographics Similar to U.S. Virgin Islanders by 2 or more Vehicles in Household
In terms of 2 or more vehicles in household, the demographic groups most similar to U.S. Virgin Islanders are Haitian (47.6%, a difference of 0.17%), Immigrants from Ghana (47.4%, a difference of 0.22%), Puerto Rican (47.1%, a difference of 0.80%), Immigrants from Belarus (47.9%, a difference of 0.91%), and Ghanaian (48.0%, a difference of 1.0%).
| Demographics | Rating | Rank | 2 or more Vehicles in Household |
| Immigrants | Israel | 0.0 /100 | #306 | Tragic 49.2% |
| Hopi | 0.0 /100 | #307 | Tragic 49.0% |
| Albanians | 0.0 /100 | #308 | Tragic 49.0% |
| Moroccans | 0.0 /100 | #309 | Tragic 48.8% |
| Ghanaians | 0.0 /100 | #310 | Tragic 48.0% |
| Immigrants | Belarus | 0.0 /100 | #311 | Tragic 47.9% |
| Haitians | 0.0 /100 | #312 | Tragic 47.6% |
| U.S. Virgin Islanders | 0.0 /100 | #313 | Tragic 47.5% |
| Immigrants | Ghana | 0.0 /100 | #314 | Tragic 47.4% |
| Puerto Ricans | 0.0 /100 | #315 | Tragic 47.1% |
| Cape Verdeans | 0.0 /100 | #316 | Tragic 46.8% |
| Immigrants | Haiti | 0.0 /100 | #317 | Tragic 46.5% |
| Immigrants | Albania | 0.0 /100 | #318 | Tragic 46.0% |
| Jamaicans | 0.0 /100 | #319 | Tragic 45.8% |
| Soviet Union | 0.0 /100 | #320 | Tragic 45.7% |
Demographics Similar to Okinawans by 2 or more Vehicles in Household
In terms of 2 or more vehicles in household, the demographic groups most similar to Okinawans are Immigrants from Serbia (51.3%, a difference of 0.12%), Immigrants from Liberia (51.3%, a difference of 0.14%), Somali (51.1%, a difference of 0.28%), Immigrants from Uruguay (51.4%, a difference of 0.29%), and Immigrants from Panama (51.1%, a difference of 0.35%).
| Demographics | Rating | Rank | 2 or more Vehicles in Household |
| Immigrants | Kazakhstan | 0.1 /100 | #281 | Tragic 51.6% |
| Bahamians | 0.1 /100 | #282 | Tragic 51.5% |
| Immigrants | China | 0.1 /100 | #283 | Tragic 51.5% |
| Immigrants | Zaire | 0.1 /100 | #284 | Tragic 51.5% |
| Immigrants | Uruguay | 0.1 /100 | #285 | Tragic 51.4% |
| Immigrants | Liberia | 0.1 /100 | #286 | Tragic 51.3% |
| Immigrants | Serbia | 0.1 /100 | #287 | Tragic 51.3% |
| Okinawans | 0.1 /100 | #288 | Tragic 51.2% |
| Somalis | 0.0 /100 | #289 | Tragic 51.1% |
| Immigrants | Panama | 0.0 /100 | #290 | Tragic 51.1% |
| Belizeans | 0.0 /100 | #291 | Tragic 51.0% |
| Immigrants | Ukraine | 0.0 /100 | #292 | Tragic 50.9% |
| Blacks/African Americans | 0.0 /100 | #293 | Tragic 50.9% |
| Bermudans | 0.0 /100 | #294 | Tragic 50.6% |
| Cypriots | 0.0 /100 | #295 | Tragic 50.6% |