U.S. Virgin Islander vs Chickasaw Single Father Households
COMPARE
U.S. Virgin Islander
Chickasaw
Single Father Households
Single Father Households Comparison
U.S. Virgin Islanders
Chickasaw
2.4%
SINGLE FATHER HOUSEHOLDS
31.8/ 100
METRIC RATING
189th/ 347
METRIC RANK
2.8%
SINGLE FATHER HOUSEHOLDS
0.0/ 100
METRIC RATING
295th/ 347
METRIC RANK
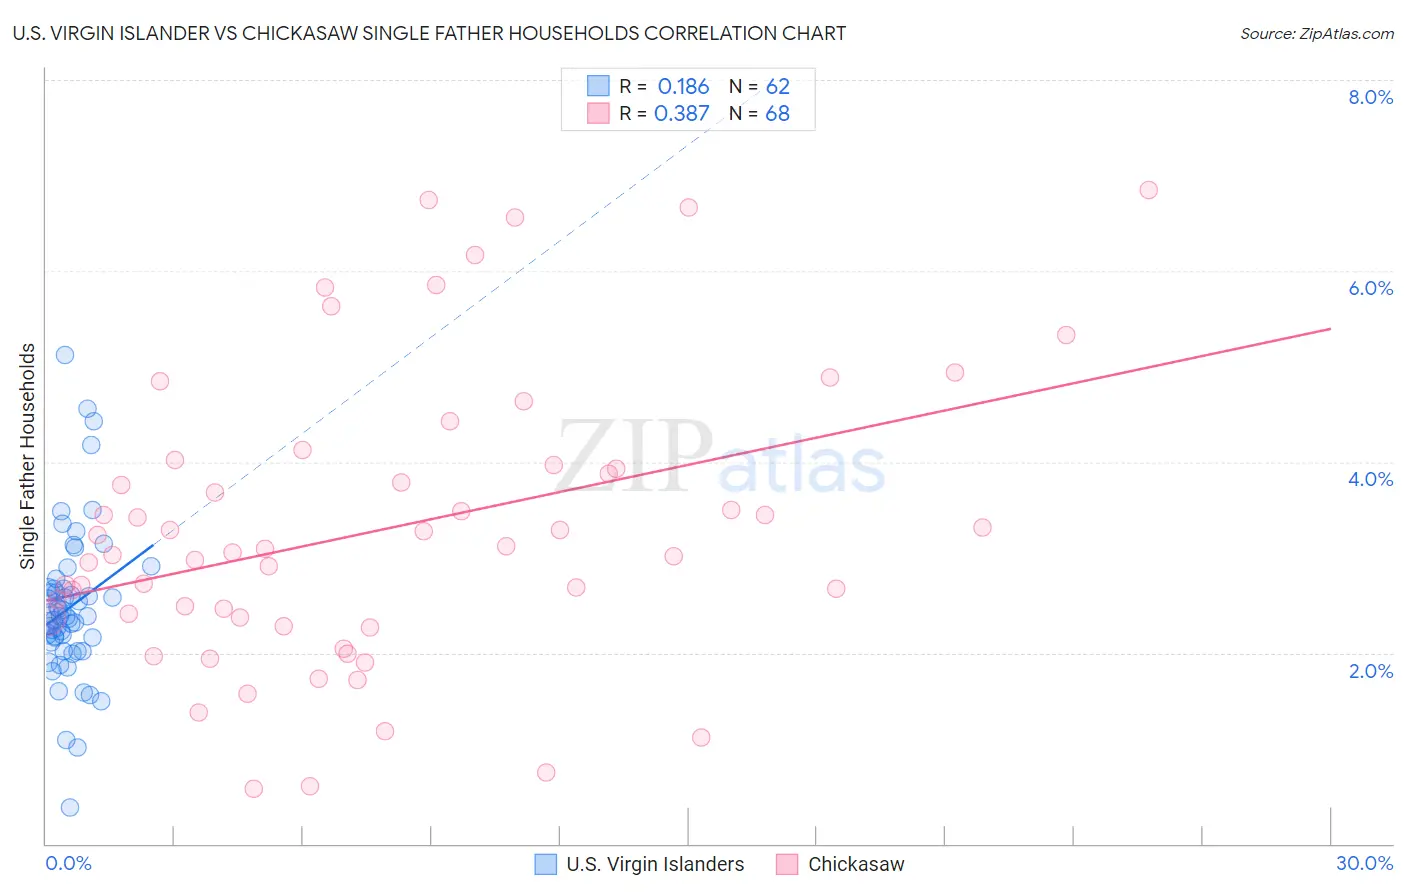
U.S. Virgin Islander vs Chickasaw Single Father Households Correlation Chart
The statistical analysis conducted on geographies consisting of 87,373,145 people shows a poor positive correlation between the proportion of U.S. Virgin Islanders and percentage of single father households in the United States with a correlation coefficient (R) of 0.186 and weighted average of 2.4%. Similarly, the statistical analysis conducted on geographies consisting of 147,211,099 people shows a mild positive correlation between the proportion of Chickasaw and percentage of single father households in the United States with a correlation coefficient (R) of 0.387 and weighted average of 2.8%, a difference of 16.1%.
Single Father Households Correlation Summary
| Measurement | U.S. Virgin Islander | Chickasaw |
| Minimum | 0.38% | 0.57% |
| Maximum | 5.1% | 6.8% |
| Range | 4.7% | 6.3% |
| Mean | 2.5% | 3.3% |
| Median | 2.4% | 3.1% |
| Interquartile 25% (IQ1) | 2.1% | 2.4% |
| Interquartile 75% (IQ3) | 2.7% | 3.9% |
| Interquartile Range (IQR) | 0.57% | 1.6% |
| Standard Deviation (Sample) | 0.80% | 1.5% |
| Standard Deviation (Population) | 0.79% | 1.5% |
Similar Demographics by Single Father Households
Demographics Similar to U.S. Virgin Islanders by Single Father Households
In terms of single father households, the demographic groups most similar to U.S. Virgin Islanders are French (2.4%, a difference of 0.0%), Hmong (2.4%, a difference of 0.10%), Immigrants from Africa (2.4%, a difference of 0.15%), Immigrants from Sudan (2.4%, a difference of 0.17%), and Immigrants from Colombia (2.4%, a difference of 0.18%).
| Demographics | Rating | Rank | Single Father Households |
| Belgians | 43.3 /100 | #182 | Average 2.3% |
| Immigrants | Panama | 41.8 /100 | #183 | Average 2.4% |
| Sri Lankans | 41.8 /100 | #184 | Average 2.4% |
| Nigerians | 41.0 /100 | #185 | Average 2.4% |
| Immigrants | Bosnia and Herzegovina | 40.4 /100 | #186 | Average 2.4% |
| Immigrants | Colombia | 34.0 /100 | #187 | Fair 2.4% |
| Hmong | 33.0 /100 | #188 | Fair 2.4% |
| U.S. Virgin Islanders | 31.8 /100 | #189 | Fair 2.4% |
| French | 31.7 /100 | #190 | Fair 2.4% |
| Immigrants | Africa | 30.0 /100 | #191 | Fair 2.4% |
| Immigrants | Sudan | 29.8 /100 | #192 | Fair 2.4% |
| Uruguayans | 29.7 /100 | #193 | Fair 2.4% |
| Panamanians | 29.6 /100 | #194 | Fair 2.4% |
| Immigrants | Philippines | 28.7 /100 | #195 | Fair 2.4% |
| Kenyans | 28.0 /100 | #196 | Fair 2.4% |
Demographics Similar to Chickasaw by Single Father Households
In terms of single father households, the demographic groups most similar to Chickasaw are Japanese (2.8%, a difference of 0.020%), Honduran (2.8%, a difference of 0.10%), Cree (2.8%, a difference of 0.59%), Malaysian (2.7%, a difference of 0.80%), and Lumbee (2.8%, a difference of 0.97%).
| Demographics | Rating | Rank | Single Father Households |
| Immigrants | Cambodia | 0.0 /100 | #288 | Tragic 2.7% |
| Tlingit-Haida | 0.0 /100 | #289 | Tragic 2.7% |
| Puget Sound Salish | 0.0 /100 | #290 | Tragic 2.7% |
| Blackfeet | 0.0 /100 | #291 | Tragic 2.7% |
| Choctaw | 0.0 /100 | #292 | Tragic 2.7% |
| Immigrants | Fiji | 0.0 /100 | #293 | Tragic 2.7% |
| Malaysians | 0.0 /100 | #294 | Tragic 2.7% |
| Chickasaw | 0.0 /100 | #295 | Tragic 2.8% |
| Japanese | 0.0 /100 | #296 | Tragic 2.8% |
| Hondurans | 0.0 /100 | #297 | Tragic 2.8% |
| Cree | 0.0 /100 | #298 | Tragic 2.8% |
| Lumbee | 0.0 /100 | #299 | Tragic 2.8% |
| Kiowa | 0.0 /100 | #300 | Tragic 2.8% |
| Immigrants | Latin America | 0.0 /100 | #301 | Tragic 2.8% |
| Spanish Americans | 0.0 /100 | #302 | Tragic 2.8% |