Nepalese vs Chickasaw 3 or more Vehicles in Household
COMPARE
Nepalese
Chickasaw
3 or more Vehicles in Household
3 or more Vehicles in Household Comparison
Nepalese
Chickasaw
24.9%
3 OR MORE VEHICLES IN HOUSEHOLD
100.0/ 100
METRIC RATING
10th/ 347
METRIC RANK
22.2%
3 OR MORE VEHICLES IN HOUSEHOLD
99.9/ 100
METRIC RATING
63rd/ 347
METRIC RANK
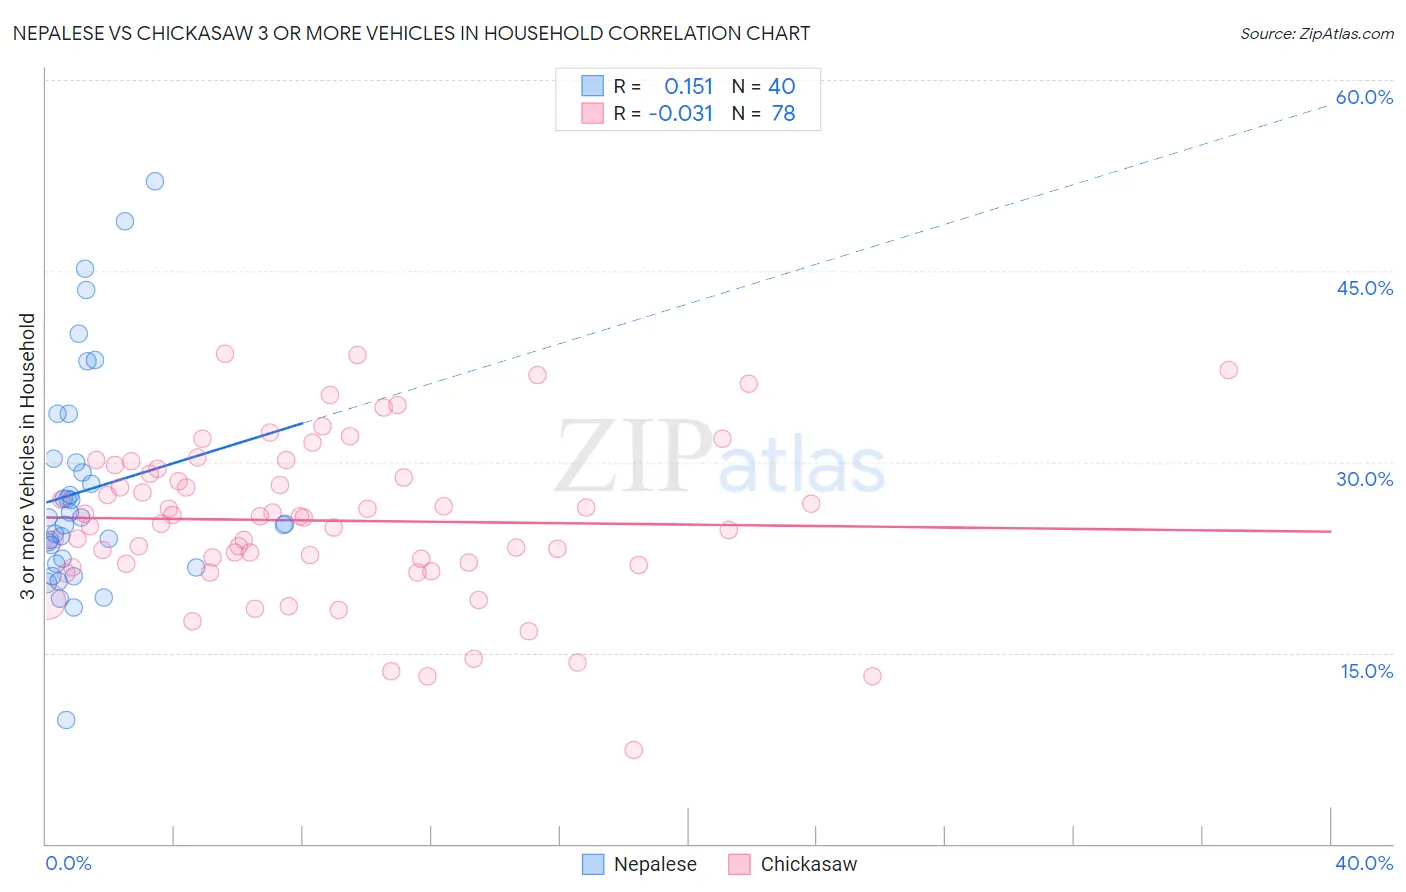
Nepalese vs Chickasaw 3 or more Vehicles in Household Correlation Chart
The statistical analysis conducted on geographies consisting of 24,521,755 people shows a poor positive correlation between the proportion of Nepalese and percentage of households with 3 or more vehicles available in the United States with a correlation coefficient (R) of 0.151 and weighted average of 24.9%. Similarly, the statistical analysis conducted on geographies consisting of 147,670,529 people shows no correlation between the proportion of Chickasaw and percentage of households with 3 or more vehicles available in the United States with a correlation coefficient (R) of -0.031 and weighted average of 22.2%, a difference of 12.2%.
3 or more Vehicles in Household Correlation Summary
| Measurement | Nepalese | Chickasaw |
| Minimum | 9.8% | 7.3% |
| Maximum | 52.0% | 38.5% |
| Range | 42.3% | 31.2% |
| Mean | 27.8% | 25.4% |
| Median | 25.4% | 25.6% |
| Interquartile 25% (IQ1) | 22.2% | 22.0% |
| Interquartile 75% (IQ3) | 30.1% | 29.5% |
| Interquartile Range (IQR) | 7.9% | 7.5% |
| Standard Deviation (Sample) | 8.8% | 6.2% |
| Standard Deviation (Population) | 8.7% | 6.2% |
Similar Demographics by 3 or more Vehicles in Household
Demographics Similar to Nepalese by 3 or more Vehicles in Household
In terms of 3 or more vehicles in household, the demographic groups most similar to Nepalese are Native Hawaiian (24.9%, a difference of 0.090%), Shoshone (24.9%, a difference of 0.10%), Samoan (25.0%, a difference of 0.19%), Danish (24.7%, a difference of 0.79%), and Mexican (24.7%, a difference of 0.87%).
| Demographics | Rating | Rank | 3 or more Vehicles in Household |
| Tongans | 100.0 /100 | #3 | Exceptional 26.5% |
| Arapaho | 100.0 /100 | #4 | Exceptional 26.4% |
| Puget Sound Salish | 100.0 /100 | #5 | Exceptional 26.4% |
| Immigrants | Fiji | 100.0 /100 | #6 | Exceptional 26.1% |
| Colville | 100.0 /100 | #7 | Exceptional 25.8% |
| Samoans | 100.0 /100 | #8 | Exceptional 25.0% |
| Native Hawaiians | 100.0 /100 | #9 | Exceptional 24.9% |
| Nepalese | 100.0 /100 | #10 | Exceptional 24.9% |
| Shoshone | 100.0 /100 | #11 | Exceptional 24.9% |
| Danes | 100.0 /100 | #12 | Exceptional 24.7% |
| Mexicans | 100.0 /100 | #13 | Exceptional 24.7% |
| Immigrants | Mexico | 100.0 /100 | #14 | Exceptional 24.6% |
| Hawaiians | 100.0 /100 | #15 | Exceptional 24.3% |
| Basques | 100.0 /100 | #16 | Exceptional 24.3% |
| Koreans | 100.0 /100 | #17 | Exceptional 24.1% |
Demographics Similar to Chickasaw by 3 or more Vehicles in Household
In terms of 3 or more vehicles in household, the demographic groups most similar to Chickasaw are Fijian (22.2%, a difference of 0.16%), Bhutanese (22.2%, a difference of 0.20%), Immigrants from Taiwan (22.1%, a difference of 0.33%), Finnish (22.3%, a difference of 0.36%), and Navajo (22.3%, a difference of 0.45%).
| Demographics | Rating | Rank | 3 or more Vehicles in Household |
| Hispanics or Latinos | 100.0 /100 | #56 | Exceptional 22.4% |
| Pennsylvania Germans | 100.0 /100 | #57 | Exceptional 22.3% |
| Spaniards | 100.0 /100 | #58 | Exceptional 22.3% |
| Navajo | 100.0 /100 | #59 | Exceptional 22.3% |
| Finns | 99.9 /100 | #60 | Exceptional 22.3% |
| Bhutanese | 99.9 /100 | #61 | Exceptional 22.2% |
| Fijians | 99.9 /100 | #62 | Exceptional 22.2% |
| Chickasaw | 99.9 /100 | #63 | Exceptional 22.2% |
| Immigrants | Taiwan | 99.9 /100 | #64 | Exceptional 22.1% |
| Pima | 99.9 /100 | #65 | Exceptional 22.0% |
| Northern Europeans | 99.9 /100 | #66 | Exceptional 22.0% |
| Alaskan Athabascans | 99.9 /100 | #67 | Exceptional 21.9% |
| British | 99.9 /100 | #68 | Exceptional 21.9% |
| Creek | 99.9 /100 | #69 | Exceptional 21.9% |
| Bangladeshis | 99.8 /100 | #70 | Exceptional 21.9% |