Immigrants from Cuba vs Immigrants from Jordan 2 or more Vehicles in Household
COMPARE
Immigrants from Cuba
Immigrants from Jordan
2 or more Vehicles in Household
2 or more Vehicles in Household Comparison
Immigrants from Cuba
Immigrants from Jordan
55.3%
2 OR MORE VEHICLES IN HOUSEHOLD
47.0/ 100
METRIC RATING
176th/ 347
METRIC RANK
57.2%
2 OR MORE VEHICLES IN HOUSEHOLD
96.6/ 100
METRIC RATING
116th/ 347
METRIC RANK
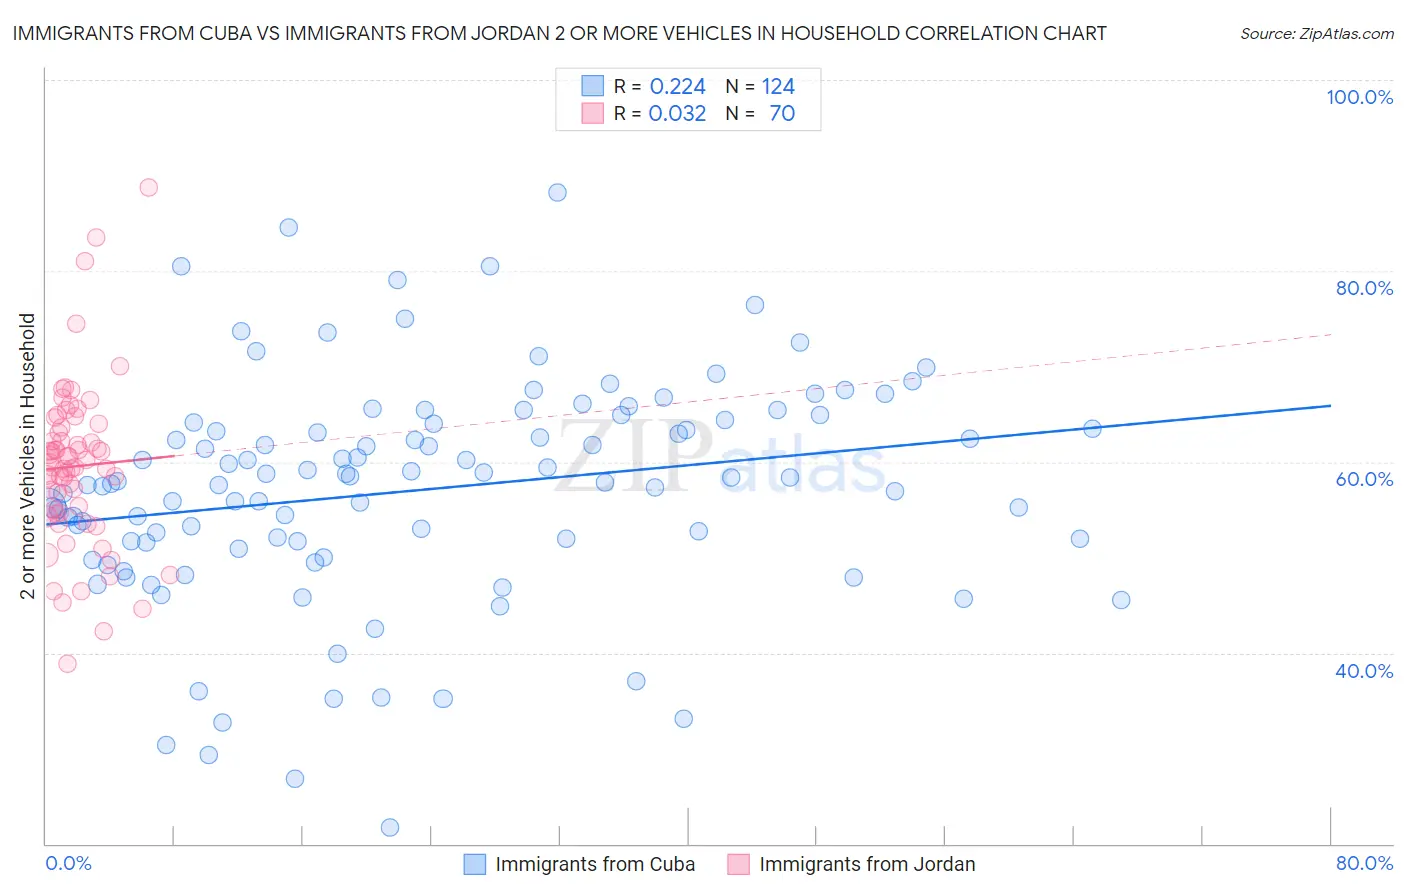
Immigrants from Cuba vs Immigrants from Jordan 2 or more Vehicles in Household Correlation Chart
The statistical analysis conducted on geographies consisting of 325,965,505 people shows a weak positive correlation between the proportion of Immigrants from Cuba and percentage of households with 2 or more vehicles available in the United States with a correlation coefficient (R) of 0.224 and weighted average of 55.3%. Similarly, the statistical analysis conducted on geographies consisting of 181,252,999 people shows no correlation between the proportion of Immigrants from Jordan and percentage of households with 2 or more vehicles available in the United States with a correlation coefficient (R) of 0.032 and weighted average of 57.2%, a difference of 3.4%.
2 or more Vehicles in Household Correlation Summary
| Measurement | Immigrants from Cuba | Immigrants from Jordan |
| Minimum | 21.7% | 38.9% |
| Maximum | 88.2% | 88.8% |
| Range | 66.5% | 49.9% |
| Mean | 57.0% | 59.5% |
| Median | 57.9% | 59.7% |
| Interquartile 25% (IQ1) | 51.6% | 54.7% |
| Interquartile 75% (IQ3) | 64.0% | 63.6% |
| Interquartile Range (IQR) | 12.4% | 8.9% |
| Standard Deviation (Sample) | 11.7% | 8.6% |
| Standard Deviation (Population) | 11.7% | 8.6% |
Similar Demographics by 2 or more Vehicles in Household
Demographics Similar to Immigrants from Cuba by 2 or more Vehicles in Household
In terms of 2 or more vehicles in household, the demographic groups most similar to Immigrants from Cuba are Menominee (55.3%, a difference of 0.030%), Immigrants from Sweden (55.2%, a difference of 0.070%), Immigrants from Denmark (55.3%, a difference of 0.090%), Navajo (55.3%, a difference of 0.12%), and Immigrants from Western Europe (55.4%, a difference of 0.17%).
| Demographics | Rating | Rank | 2 or more Vehicles in Household |
| Immigrants | Austria | 56.3 /100 | #169 | Average 55.5% |
| Romanians | 55.8 /100 | #170 | Average 55.5% |
| Immigrants | Costa Rica | 54.4 /100 | #171 | Average 55.4% |
| Immigrants | Nicaragua | 51.6 /100 | #172 | Average 55.4% |
| Immigrants | Western Europe | 51.4 /100 | #173 | Average 55.4% |
| Navajo | 50.0 /100 | #174 | Average 55.3% |
| Immigrants | Denmark | 49.4 /100 | #175 | Average 55.3% |
| Immigrants | Cuba | 47.0 /100 | #176 | Average 55.3% |
| Menominee | 46.2 /100 | #177 | Average 55.3% |
| Immigrants | Sweden | 45.3 /100 | #178 | Average 55.2% |
| Alaskan Athabascans | 42.9 /100 | #179 | Average 55.2% |
| Immigrants | Kenya | 40.4 /100 | #180 | Average 55.1% |
| Immigrants | Micronesia | 38.2 /100 | #181 | Fair 55.1% |
| Cree | 38.2 /100 | #182 | Fair 55.1% |
| Immigrants | Cameroon | 37.3 /100 | #183 | Fair 55.1% |
Demographics Similar to Immigrants from Jordan by 2 or more Vehicles in Household
In terms of 2 or more vehicles in household, the demographic groups most similar to Immigrants from Jordan are Chippewa (57.2%, a difference of 0.010%), Immigrants from Lebanon (57.2%, a difference of 0.070%), Zimbabwean (57.2%, a difference of 0.10%), Iraqi (57.1%, a difference of 0.19%), and Asian (57.0%, a difference of 0.36%).
| Demographics | Rating | Rank | 2 or more Vehicles in Household |
| Immigrants | North America | 98.1 /100 | #109 | Exceptional 57.5% |
| Japanese | 98.0 /100 | #110 | Exceptional 57.5% |
| Greeks | 98.0 /100 | #111 | Exceptional 57.5% |
| Pueblo | 98.0 /100 | #112 | Exceptional 57.5% |
| Zimbabweans | 96.9 /100 | #113 | Exceptional 57.2% |
| Immigrants | Lebanon | 96.8 /100 | #114 | Exceptional 57.2% |
| Chippewa | 96.6 /100 | #115 | Exceptional 57.2% |
| Immigrants | Jordan | 96.6 /100 | #116 | Exceptional 57.2% |
| Iraqis | 95.8 /100 | #117 | Exceptional 57.1% |
| Asians | 95.1 /100 | #118 | Exceptional 57.0% |
| Natives/Alaskans | 95.0 /100 | #119 | Exceptional 57.0% |
| Costa Ricans | 94.7 /100 | #120 | Exceptional 56.9% |
| Sioux | 93.8 /100 | #121 | Exceptional 56.8% |
| Immigrants | South Africa | 92.5 /100 | #122 | Exceptional 56.7% |
| Australians | 91.8 /100 | #123 | Exceptional 56.7% |