Turkish vs Immigrants from Jordan 9th Grade
COMPARE
Turkish
Immigrants from Jordan
9th Grade
9th Grade Comparison
Turks
Immigrants from Jordan
95.8%
9TH GRADE
99.5/ 100
METRIC RATING
72nd/ 347
METRIC RANK
95.1%
9TH GRADE
81.2/ 100
METRIC RATING
148th/ 347
METRIC RANK
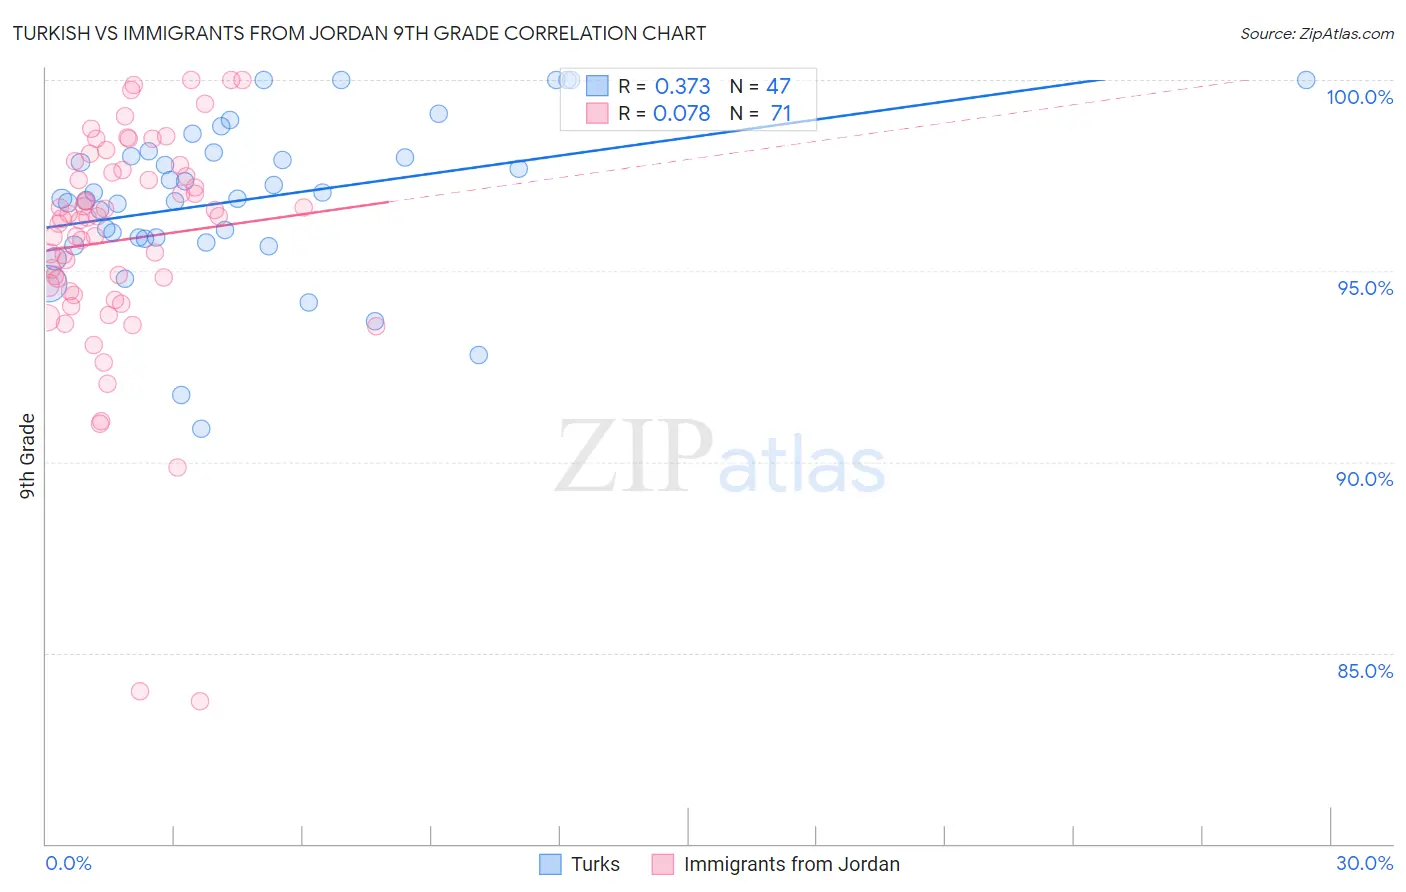
Turkish vs Immigrants from Jordan 9th Grade Correlation Chart
The statistical analysis conducted on geographies consisting of 271,864,133 people shows a mild positive correlation between the proportion of Turks and percentage of population with at least 9th grade education in the United States with a correlation coefficient (R) of 0.373 and weighted average of 95.8%. Similarly, the statistical analysis conducted on geographies consisting of 181,278,272 people shows a slight positive correlation between the proportion of Immigrants from Jordan and percentage of population with at least 9th grade education in the United States with a correlation coefficient (R) of 0.078 and weighted average of 95.1%, a difference of 0.71%.
9th Grade Correlation Summary
| Measurement | Turkish | Immigrants from Jordan |
| Minimum | 90.9% | 83.7% |
| Maximum | 100.0% | 100.0% |
| Range | 9.1% | 16.3% |
| Mean | 96.9% | 95.8% |
| Median | 96.9% | 96.4% |
| Interquartile 25% (IQ1) | 95.9% | 94.5% |
| Interquartile 75% (IQ3) | 98.1% | 97.6% |
| Interquartile Range (IQR) | 2.3% | 3.2% |
| Standard Deviation (Sample) | 2.1% | 3.0% |
| Standard Deviation (Population) | 2.1% | 3.0% |
Similar Demographics by 9th Grade
Demographics Similar to Turks by 9th Grade
In terms of 9th grade, the demographic groups most similar to Turks are Immigrants from Belgium (95.8%, a difference of 0.0%), Immigrants from Singapore (95.8%, a difference of 0.0%), Immigrants from Australia (95.8%, a difference of 0.010%), Thai (95.8%, a difference of 0.010%), and Immigrants from Ireland (95.8%, a difference of 0.020%).
| Demographics | Rating | Rank | 9th Grade |
| Immigrants | England | 99.6 /100 | #65 | Exceptional 95.9% |
| Immigrants | Netherlands | 99.6 /100 | #66 | Exceptional 95.8% |
| Cypriots | 99.6 /100 | #67 | Exceptional 95.8% |
| Immigrants | Ireland | 99.6 /100 | #68 | Exceptional 95.8% |
| Immigrants | Lithuania | 99.6 /100 | #69 | Exceptional 95.8% |
| Immigrants | Australia | 99.5 /100 | #70 | Exceptional 95.8% |
| Immigrants | Belgium | 99.5 /100 | #71 | Exceptional 95.8% |
| Turks | 99.5 /100 | #72 | Exceptional 95.8% |
| Immigrants | Singapore | 99.5 /100 | #73 | Exceptional 95.8% |
| Thais | 99.5 /100 | #74 | Exceptional 95.8% |
| Inupiat | 99.5 /100 | #75 | Exceptional 95.8% |
| Immigrants | Sweden | 99.5 /100 | #76 | Exceptional 95.8% |
| Whites/Caucasians | 99.4 /100 | #77 | Exceptional 95.8% |
| Immigrants | South Africa | 99.4 /100 | #78 | Exceptional 95.8% |
| Romanians | 99.3 /100 | #79 | Exceptional 95.7% |
Demographics Similar to Immigrants from Jordan by 9th Grade
In terms of 9th grade, the demographic groups most similar to Immigrants from Jordan are Pueblo (95.1%, a difference of 0.010%), Immigrants from Sri Lanka (95.1%, a difference of 0.010%), Choctaw (95.1%, a difference of 0.010%), Immigrants from Korea (95.1%, a difference of 0.020%), and Kenyan (95.1%, a difference of 0.020%).
| Demographics | Rating | Rank | 9th Grade |
| Immigrants | Bosnia and Herzegovina | 85.2 /100 | #141 | Excellent 95.2% |
| Immigrants | Greece | 84.6 /100 | #142 | Excellent 95.2% |
| Spanish | 84.4 /100 | #143 | Excellent 95.2% |
| Yup'ik | 83.3 /100 | #144 | Excellent 95.2% |
| Pueblo | 82.2 /100 | #145 | Excellent 95.1% |
| Immigrants | Sri Lanka | 82.1 /100 | #146 | Excellent 95.1% |
| Choctaw | 81.9 /100 | #147 | Excellent 95.1% |
| Immigrants | Jordan | 81.2 /100 | #148 | Excellent 95.1% |
| Immigrants | Korea | 79.6 /100 | #149 | Good 95.1% |
| Kenyans | 79.1 /100 | #150 | Good 95.1% |
| Cajuns | 77.3 /100 | #151 | Good 95.1% |
| Ugandans | 77.0 /100 | #152 | Good 95.1% |
| Albanians | 76.1 /100 | #153 | Good 95.1% |
| Arabs | 74.9 /100 | #154 | Good 95.1% |
| Immigrants | Kazakhstan | 74.7 /100 | #155 | Good 95.1% |