Turkish vs Immigrants from Jordan Associate's Degree
COMPARE
Turkish
Immigrants from Jordan
Associate's Degree
Associate's Degree Comparison
Turks
Immigrants from Jordan
53.9%
ASSOCIATE'S DEGREE
100.0/ 100
METRIC RATING
28th/ 347
METRIC RANK
48.4%
ASSOCIATE'S DEGREE
91.2/ 100
METRIC RATING
130th/ 347
METRIC RANK
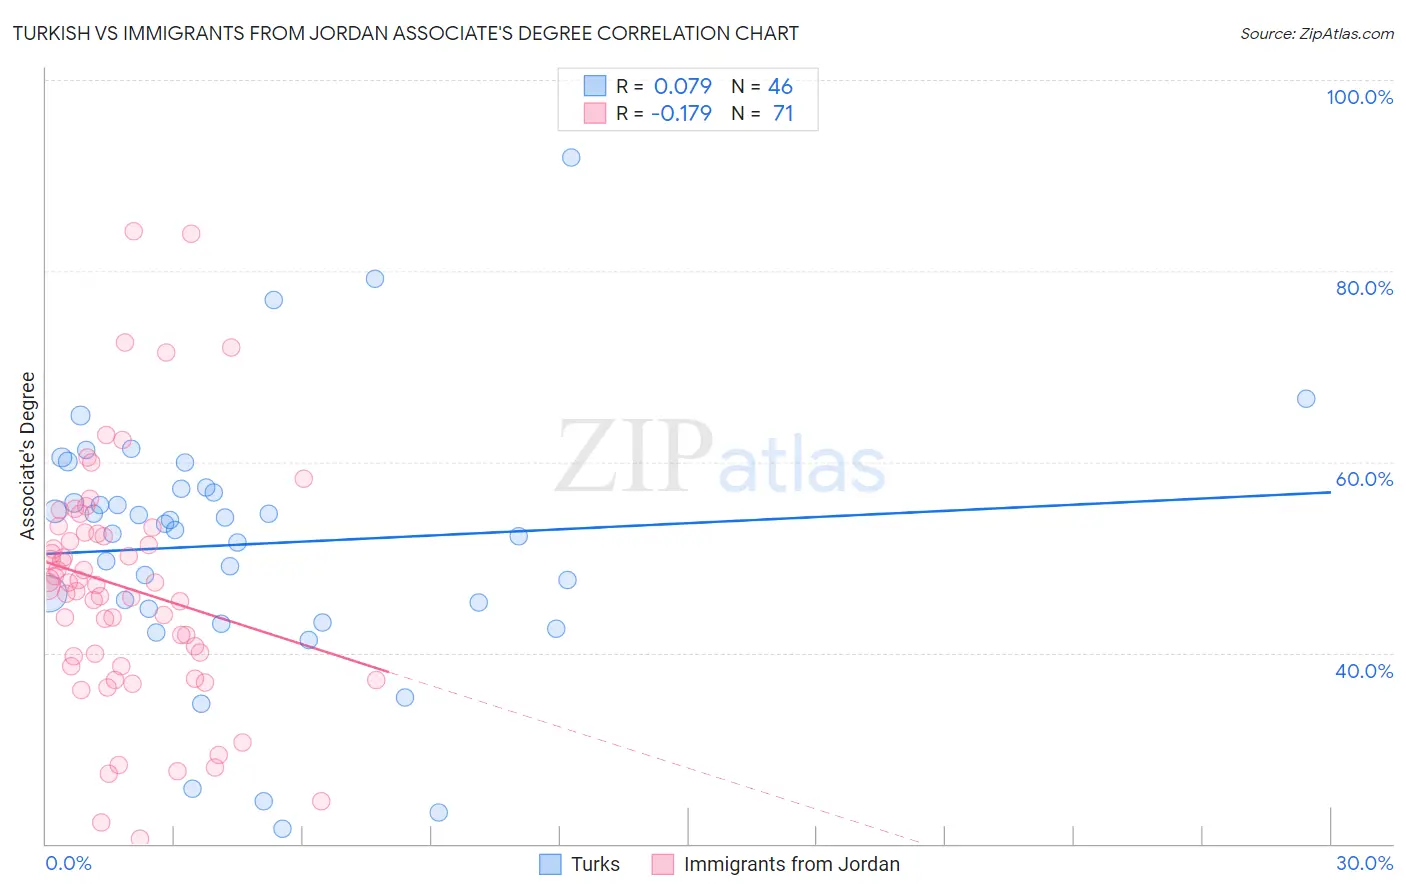
Turkish vs Immigrants from Jordan Associate's Degree Correlation Chart
The statistical analysis conducted on geographies consisting of 271,852,708 people shows a slight positive correlation between the proportion of Turks and percentage of population with at least associate's degree education in the United States with a correlation coefficient (R) of 0.079 and weighted average of 53.9%. Similarly, the statistical analysis conducted on geographies consisting of 181,277,239 people shows a poor negative correlation between the proportion of Immigrants from Jordan and percentage of population with at least associate's degree education in the United States with a correlation coefficient (R) of -0.179 and weighted average of 48.4%, a difference of 11.4%.
Associate's Degree Correlation Summary
| Measurement | Turkish | Immigrants from Jordan |
| Minimum | 21.5% | 20.5% |
| Maximum | 91.9% | 84.2% |
| Range | 70.3% | 63.7% |
| Mean | 51.4% | 46.9% |
| Median | 53.2% | 47.1% |
| Interquartile 25% (IQ1) | 44.6% | 38.6% |
| Interquartile 75% (IQ3) | 57.2% | 52.6% |
| Interquartile Range (IQR) | 12.6% | 14.0% |
| Standard Deviation (Sample) | 13.6% | 12.7% |
| Standard Deviation (Population) | 13.4% | 12.6% |
Similar Demographics by Associate's Degree
Demographics Similar to Turks by Associate's Degree
In terms of associate's degree, the demographic groups most similar to Turks are Immigrants from France (53.9%, a difference of 0.010%), Latvian (53.9%, a difference of 0.070%), Immigrants from Sri Lanka (53.7%, a difference of 0.43%), Immigrants from Northern Europe (53.5%, a difference of 0.79%), and Immigrants from Turkey (53.4%, a difference of 0.82%).
| Demographics | Rating | Rank | Associate's Degree |
| Immigrants | Sweden | 100.0 /100 | #21 | Exceptional 54.6% |
| Immigrants | Japan | 100.0 /100 | #22 | Exceptional 54.6% |
| Burmese | 100.0 /100 | #23 | Exceptional 54.6% |
| Immigrants | Korea | 100.0 /100 | #24 | Exceptional 54.5% |
| Immigrants | Switzerland | 100.0 /100 | #25 | Exceptional 54.5% |
| Immigrants | Belgium | 100.0 /100 | #26 | Exceptional 54.5% |
| Latvians | 100.0 /100 | #27 | Exceptional 53.9% |
| Turks | 100.0 /100 | #28 | Exceptional 53.9% |
| Immigrants | France | 100.0 /100 | #29 | Exceptional 53.9% |
| Immigrants | Sri Lanka | 100.0 /100 | #30 | Exceptional 53.7% |
| Immigrants | Northern Europe | 100.0 /100 | #31 | Exceptional 53.5% |
| Immigrants | Turkey | 100.0 /100 | #32 | Exceptional 53.4% |
| Israelis | 100.0 /100 | #33 | Exceptional 53.4% |
| Bulgarians | 100.0 /100 | #34 | Exceptional 53.3% |
| Russians | 100.0 /100 | #35 | Exceptional 53.2% |
Demographics Similar to Immigrants from Jordan by Associate's Degree
In terms of associate's degree, the demographic groups most similar to Immigrants from Jordan are Swedish (48.4%, a difference of 0.060%), Immigrants from Eastern Africa (48.4%, a difference of 0.090%), Icelander (48.3%, a difference of 0.10%), Immigrants from Uganda (48.5%, a difference of 0.21%), and Immigrants from Syria (48.5%, a difference of 0.22%).
| Demographics | Rating | Rank | Associate's Degree |
| Brazilians | 93.7 /100 | #123 | Exceptional 48.7% |
| Serbians | 92.6 /100 | #124 | Exceptional 48.5% |
| Chinese | 92.5 /100 | #125 | Exceptional 48.5% |
| Immigrants | Syria | 92.2 /100 | #126 | Exceptional 48.5% |
| Immigrants | Uganda | 92.1 /100 | #127 | Exceptional 48.5% |
| Immigrants | Eastern Africa | 91.6 /100 | #128 | Exceptional 48.4% |
| Swedes | 91.5 /100 | #129 | Exceptional 48.4% |
| Immigrants | Jordan | 91.2 /100 | #130 | Exceptional 48.4% |
| Icelanders | 90.8 /100 | #131 | Exceptional 48.3% |
| Immigrants | Albania | 89.9 /100 | #132 | Excellent 48.2% |
| Assyrians/Chaldeans/Syriacs | 89.4 /100 | #133 | Excellent 48.2% |
| Moroccans | 89.3 /100 | #134 | Excellent 48.2% |
| Europeans | 89.0 /100 | #135 | Excellent 48.2% |
| Pakistanis | 88.0 /100 | #136 | Excellent 48.1% |
| Immigrants | Eritrea | 87.8 /100 | #137 | Excellent 48.1% |