Turkish vs Immigrants from Jordan 11th Grade
COMPARE
Turkish
Immigrants from Jordan
11th Grade
11th Grade Comparison
Turks
Immigrants from Jordan
94.0%
11TH GRADE
99.9/ 100
METRIC RATING
51st/ 347
METRIC RANK
93.1%
11TH GRADE
92.4/ 100
METRIC RATING
128th/ 347
METRIC RANK
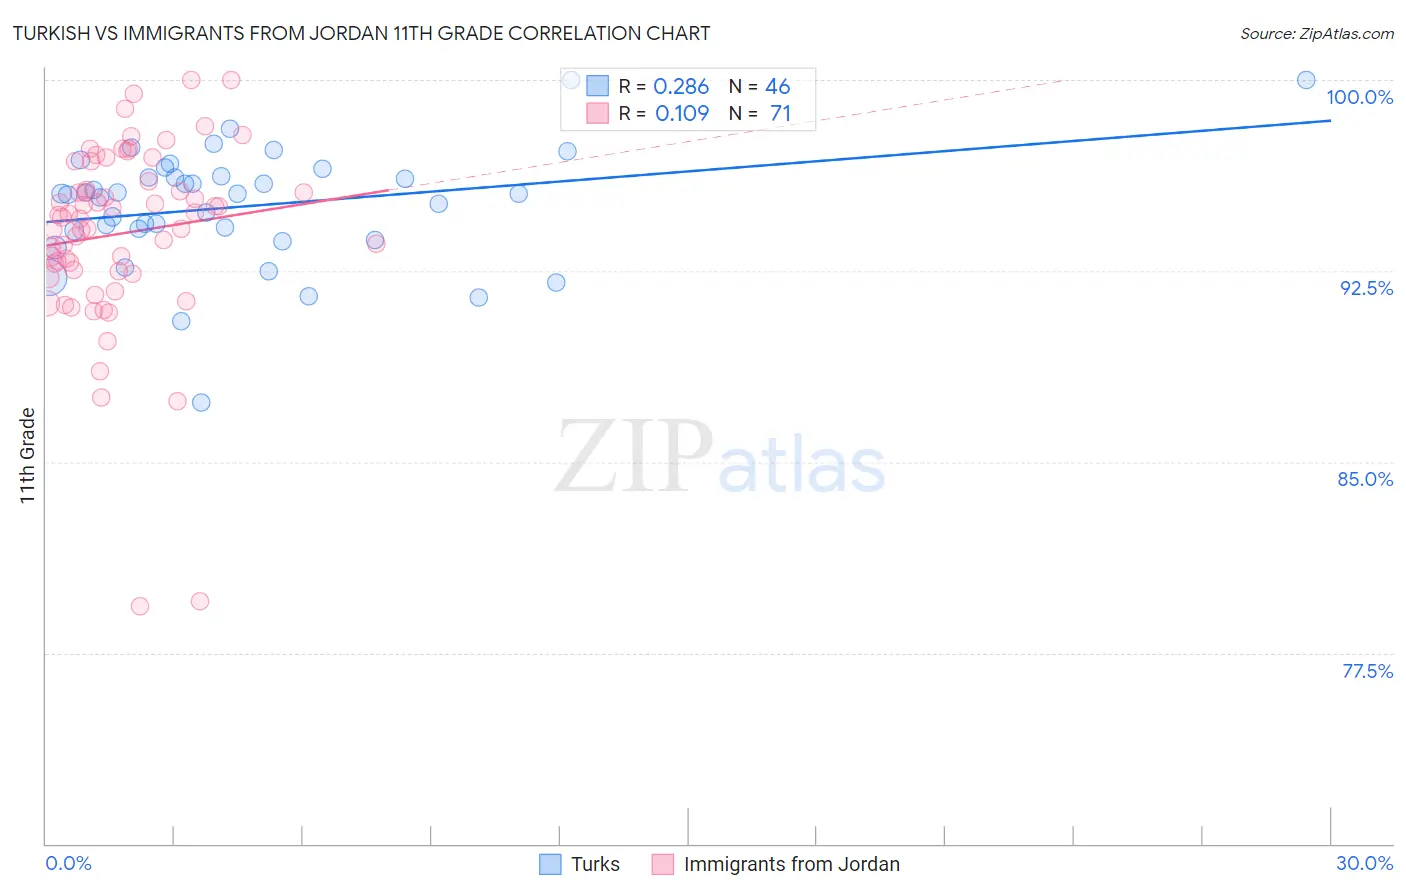
Turkish vs Immigrants from Jordan 11th Grade Correlation Chart
The statistical analysis conducted on geographies consisting of 271,864,104 people shows a weak positive correlation between the proportion of Turks and percentage of population with at least 11th grade education in the United States with a correlation coefficient (R) of 0.286 and weighted average of 94.0%. Similarly, the statistical analysis conducted on geographies consisting of 181,278,272 people shows a poor positive correlation between the proportion of Immigrants from Jordan and percentage of population with at least 11th grade education in the United States with a correlation coefficient (R) of 0.109 and weighted average of 93.1%, a difference of 1.0%.
11th Grade Correlation Summary
| Measurement | Turkish | Immigrants from Jordan |
| Minimum | 87.4% | 79.3% |
| Maximum | 100.0% | 100.0% |
| Range | 12.6% | 20.7% |
| Mean | 95.0% | 94.0% |
| Median | 95.5% | 94.6% |
| Interquartile 25% (IQ1) | 94.1% | 92.5% |
| Interquartile 75% (IQ3) | 96.2% | 96.0% |
| Interquartile Range (IQR) | 2.1% | 3.5% |
| Standard Deviation (Sample) | 2.3% | 3.7% |
| Standard Deviation (Population) | 2.3% | 3.7% |
Similar Demographics by 11th Grade
Demographics Similar to Turks by 11th Grade
In terms of 11th grade, the demographic groups most similar to Turks are Immigrants from Canada (94.0%, a difference of 0.010%), Immigrants from Australia (94.0%, a difference of 0.020%), Filipino (94.1%, a difference of 0.030%), Macedonian (94.1%, a difference of 0.030%), and Slavic (94.1%, a difference of 0.030%).
| Demographics | Rating | Rank | 11th Grade |
| Immigrants | Ireland | 99.9 /100 | #44 | Exceptional 94.1% |
| Australians | 99.9 /100 | #45 | Exceptional 94.1% |
| Serbians | 99.9 /100 | #46 | Exceptional 94.1% |
| Filipinos | 99.9 /100 | #47 | Exceptional 94.1% |
| Macedonians | 99.9 /100 | #48 | Exceptional 94.1% |
| Slavs | 99.9 /100 | #49 | Exceptional 94.1% |
| French | 99.9 /100 | #50 | Exceptional 94.1% |
| Turks | 99.9 /100 | #51 | Exceptional 94.0% |
| Immigrants | Canada | 99.9 /100 | #52 | Exceptional 94.0% |
| Immigrants | Australia | 99.9 /100 | #53 | Exceptional 94.0% |
| Immigrants | North America | 99.9 /100 | #54 | Exceptional 94.0% |
| Czechoslovakians | 99.9 /100 | #55 | Exceptional 94.0% |
| French Canadians | 99.9 /100 | #56 | Exceptional 94.0% |
| New Zealanders | 99.9 /100 | #57 | Exceptional 94.0% |
| Iranians | 99.9 /100 | #58 | Exceptional 94.0% |
Demographics Similar to Immigrants from Jordan by 11th Grade
In terms of 11th grade, the demographic groups most similar to Immigrants from Jordan are Immigrants from Kazakhstan (93.1%, a difference of 0.0%), Immigrants from Ukraine (93.0%, a difference of 0.080%), Albanian (93.0%, a difference of 0.090%), Egyptian (93.0%, a difference of 0.090%), and Immigrants from Bosnia and Herzegovina (93.0%, a difference of 0.10%).
| Demographics | Rating | Rank | 11th Grade |
| German Russians | 96.4 /100 | #121 | Exceptional 93.3% |
| Immigrants | Belarus | 96.3 /100 | #122 | Exceptional 93.3% |
| Immigrants | Greece | 95.9 /100 | #123 | Exceptional 93.2% |
| Immigrants | Eastern Europe | 95.9 /100 | #124 | Exceptional 93.2% |
| Immigrants | Sri Lanka | 95.6 /100 | #125 | Exceptional 93.2% |
| Basques | 95.2 /100 | #126 | Exceptional 93.2% |
| Immigrants | Kazakhstan | 92.4 /100 | #127 | Exceptional 93.1% |
| Immigrants | Jordan | 92.4 /100 | #128 | Exceptional 93.1% |
| Immigrants | Ukraine | 89.8 /100 | #129 | Excellent 93.0% |
| Albanians | 89.5 /100 | #130 | Excellent 93.0% |
| Egyptians | 89.5 /100 | #131 | Excellent 93.0% |
| Immigrants | Bosnia and Herzegovina | 89.0 /100 | #132 | Excellent 93.0% |
| Mongolians | 87.6 /100 | #133 | Excellent 93.0% |
| Delaware | 87.3 /100 | #134 | Excellent 93.0% |
| Immigrants | Italy | 86.6 /100 | #135 | Excellent 92.9% |