Soviet Union vs Immigrants from Afghanistan 3 or more Vehicles in Household

COMPARE

Soviet Union
Race
Ancestry
AfghanAfricanAlaska NativeAlaskan AthabascanAlbanianAleutAlsatianAmericanApacheArabArapahoArgentineanArmenianAssyrian/Chaldean/SyriacAustralianAustrianBahamianBangladeshiBarbadianBasqueBelgianBelizeanBermudanBhutaneseBlackfeetBolivianBrazilianBritishBritish West IndianBulgarianBurmeseCajunCambodianCanadianCape VerdeanCarpatho RusynCelticCentral AmericanCentral American IndianCherokeeCheyenneChickasawChileanChineseChippewaChoctawColombianColvilleComancheCosta RicanCreeCreekCroatianCrowCubanCypriotCzechCzechoslovakianDanishDelawareDominicanDutchDutch West IndianEastern EuropeanEcuadorianEgyptianEnglishEstonianEthiopianEuropeanFijianFilipinoFinnishFrenchFrench American IndianFrench CanadianGermanGerman RussianGhanaianGreekGuamanian/ChamorroGuatemalanGuyaneseHaitianHmongHonduranHopiHoumaHungarianIcelanderIndian (Asian)IndonesianInupiatIranianIraqiIrishIroquoisIsraeliItalianJamaicanJapaneseJordanianKenyanKiowaKoreanLaotianLatvianLebaneseLiberianLithuanianLumbeeLuxembourgerMacedonianMalaysianMalteseMarshalleseMenomineeMexicanMexican American IndianMongolianMoroccanNative HawaiianNavajoNepaleseNew ZealanderNicaraguanNigerianNorthern EuropeanNorwegianOkinawanOsageOttawaPaiutePakistaniPalestinianPanamanianParaguayanPennsylvania GermanPeruvianPimaPolishPortuguesePotawatomiPuebloPuerto RicanPuget Sound SalishRomanianRussianSalvadoranSamoanScandinavianScotch-IrishScottishSeminoleSenegaleseSerbianShoshoneSierra LeoneanSiouxSlavicSlovakSloveneSomaliSouth AfricanSouth AmericanSouth American IndianSoviet UnionSpaniardSpanishSpanish AmericanSpanish American IndianSri LankanSubsaharan AfricanSudaneseSwedishSwissSyrianTaiwaneseThaiTlingit-HaidaTohono O'OdhamTonganTrinidadian and TobagonianTsimshianTurkishU.S. Virgin IslanderUgandanUkrainianUruguayanUteVenezuelanVietnameseWelshWest IndianYakamaYaquiYugoslavianYumanYup'ikZimbabwean
Immigration
NonimmigrantsImmigrantsAfricaAlbaniaArgentinaArmeniaAsiaAustraliaAustriaBahamasBangladeshBarbadosBelarusBelgiumBelizeBoliviaBosnia and HerzegovinaBrazilBulgariaBurma/MyanmarCabo VerdeCambodiaCameroonCanadaCaribbeanCentral AmericaChileChinaColombiaCongoCosta RicaCroatiaCubaCzechoslovakiaDenmarkDominicaDominican RepublicEastern AfricaEastern AsiaEastern EuropeEcuadorEgyptEl SalvadorEnglandEritreaEthiopiaEuropeFijiFranceGermanyGhanaGreeceGrenadaGuatemalaGuyanaHaitiHondurasHong KongHungaryIndiaIndonesiaIranIraqIrelandIsraelItalyJamaicaJapanJordanKazakhstanKenyaKoreaKuwaitLaosLatin AmericaLatviaLebanonLiberiaLithuaniaMalaysiaMexicoMicronesiaMiddle AfricaMoldovaMoroccoNepalNetherlandsNicaraguaNigeriaNorth AmericaNorth MacedoniaNorthern AfricaNorthern EuropeNorwayOceaniaPakistanPanamaPeruPhilippinesPolandPortugalRomaniaRussiaSaudi ArabiaScotlandSenegalSerbiaSierra LeoneSingaporeSomaliaSouth AfricaSouth AmericaSouth Central AsiaSouth Eastern AsiaSouthern EuropeSpainSri LankaSt. Vincent and the GrenadinesSudanSwedenSwitzerlandSyriaTaiwanThailandTrinidad and TobagoTurkeyUgandaUkraineUruguayUzbekistanVenezuelaVietnamWest IndiesWestern AfricaWestern AsiaWestern EuropeYemenZaireZimbabweAzores
Immigrants from Afghanistan
Race
Ancestry
AfghanAfricanAlaska NativeAlaskan AthabascanAlbanianAleutAlsatianAmericanApacheArabArapahoArgentineanArmenianAssyrian/Chaldean/SyriacAustralianAustrianBahamianBangladeshiBarbadianBasqueBelgianBelizeanBermudanBhutaneseBlackfeetBolivianBrazilianBritishBritish West IndianBulgarianBurmeseCajunCambodianCanadianCape VerdeanCarpatho RusynCelticCentral AmericanCentral American IndianCherokeeCheyenneChickasawChileanChineseChippewaChoctawColombianColvilleComancheCosta RicanCreeCreekCroatianCrowCubanCypriotCzechCzechoslovakianDanishDelawareDominicanDutchDutch West IndianEastern EuropeanEcuadorianEgyptianEnglishEstonianEthiopianEuropeanFijianFilipinoFinnishFrenchFrench American IndianFrench CanadianGermanGerman RussianGhanaianGreekGuamanian/ChamorroGuatemalanGuyaneseHaitianHmongHonduranHopiHoumaHungarianIcelanderIndian (Asian)IndonesianInupiatIranianIraqiIrishIroquoisIsraeliItalianJamaicanJapaneseJordanianKenyanKiowaKoreanLaotianLatvianLebaneseLiberianLithuanianLumbeeLuxembourgerMacedonianMalaysianMalteseMarshalleseMenomineeMexicanMexican American IndianMongolianMoroccanNative HawaiianNavajoNepaleseNew ZealanderNicaraguanNigerianNorthern EuropeanNorwegianOkinawanOsageOttawaPaiutePakistaniPalestinianPanamanianParaguayanPennsylvania GermanPeruvianPimaPolishPortuguesePotawatomiPuebloPuerto RicanPuget Sound SalishRomanianRussianSalvadoranSamoanScandinavianScotch-IrishScottishSeminoleSenegaleseSerbianShoshoneSierra LeoneanSiouxSlavicSlovakSloveneSomaliSouth AfricanSouth AmericanSouth American IndianSpaniardSpanishSpanish AmericanSpanish American IndianSri LankanSubsaharan AfricanSudaneseSwedishSwissSyrianTaiwaneseThaiTlingit-HaidaTohono O'OdhamTonganTrinidadian and TobagonianTsimshianTurkishU.S. Virgin IslanderUgandanUkrainianUruguayanUteVenezuelanVietnameseWelshWest IndianYakamaYaquiYugoslavianYumanYup'ikZimbabwean
Immigration
NonimmigrantsImmigrantsAfghanistanAfricaAlbaniaArgentinaArmeniaAsiaAustraliaAustriaBahamasBangladeshBarbadosBelarusBelgiumBelizeBoliviaBosnia and HerzegovinaBrazilBulgariaBurma/MyanmarCabo VerdeCambodiaCameroonCanadaCaribbeanCentral AmericaChileChinaColombiaCongoCosta RicaCroatiaCubaCzechoslovakiaDenmarkDominicaDominican RepublicEastern AfricaEastern AsiaEastern EuropeEcuadorEgyptEl SalvadorEnglandEritreaEthiopiaEuropeFijiFranceGermanyGhanaGreeceGrenadaGuatemalaGuyanaHaitiHondurasHong KongHungaryIndiaIndonesiaIranIraqIrelandIsraelItalyJamaicaJapanJordanKazakhstanKenyaKoreaKuwaitLaosLatin AmericaLatviaLebanonLiberiaLithuaniaMalaysiaMexicoMicronesiaMiddle AfricaMoldovaMoroccoNepalNetherlandsNicaraguaNigeriaNorth AmericaNorth MacedoniaNorthern AfricaNorthern EuropeNorwayOceaniaPakistanPanamaPeruPhilippinesPolandPortugalRomaniaRussiaSaudi ArabiaScotlandSenegalSerbiaSierra LeoneSingaporeSomaliaSouth AfricaSouth AmericaSouth Central AsiaSouth Eastern AsiaSouthern EuropeSpainSri LankaSt. Vincent and the GrenadinesSudanSwedenSwitzerlandSyriaTaiwanThailandTrinidad and TobagoTurkeyUgandaUkraineUruguayUzbekistanVenezuelaVietnamWest IndiesWestern AfricaWestern AsiaWestern EuropeYemenZaireZimbabweAzores
3 or more Vehicles in Household
Income
Poverty
Unemployment
Labor Participation
Family Structure
Vehicle Availability
Education Level
Disability

3 or more Vehicles in Household Comparison

Soviet Union

Immigrants from Afghanistan

Tragic
Exceptional
14.2%
3 OR MORE VEHICLES IN HOUSEHOLD
0.0/ 100
METRIC RATING
326th/ 347
METRIC RANK
21.2%
3 OR MORE VEHICLES IN HOUSEHOLD
99.1/ 100
METRIC RATING
90th/ 347
METRIC RANK

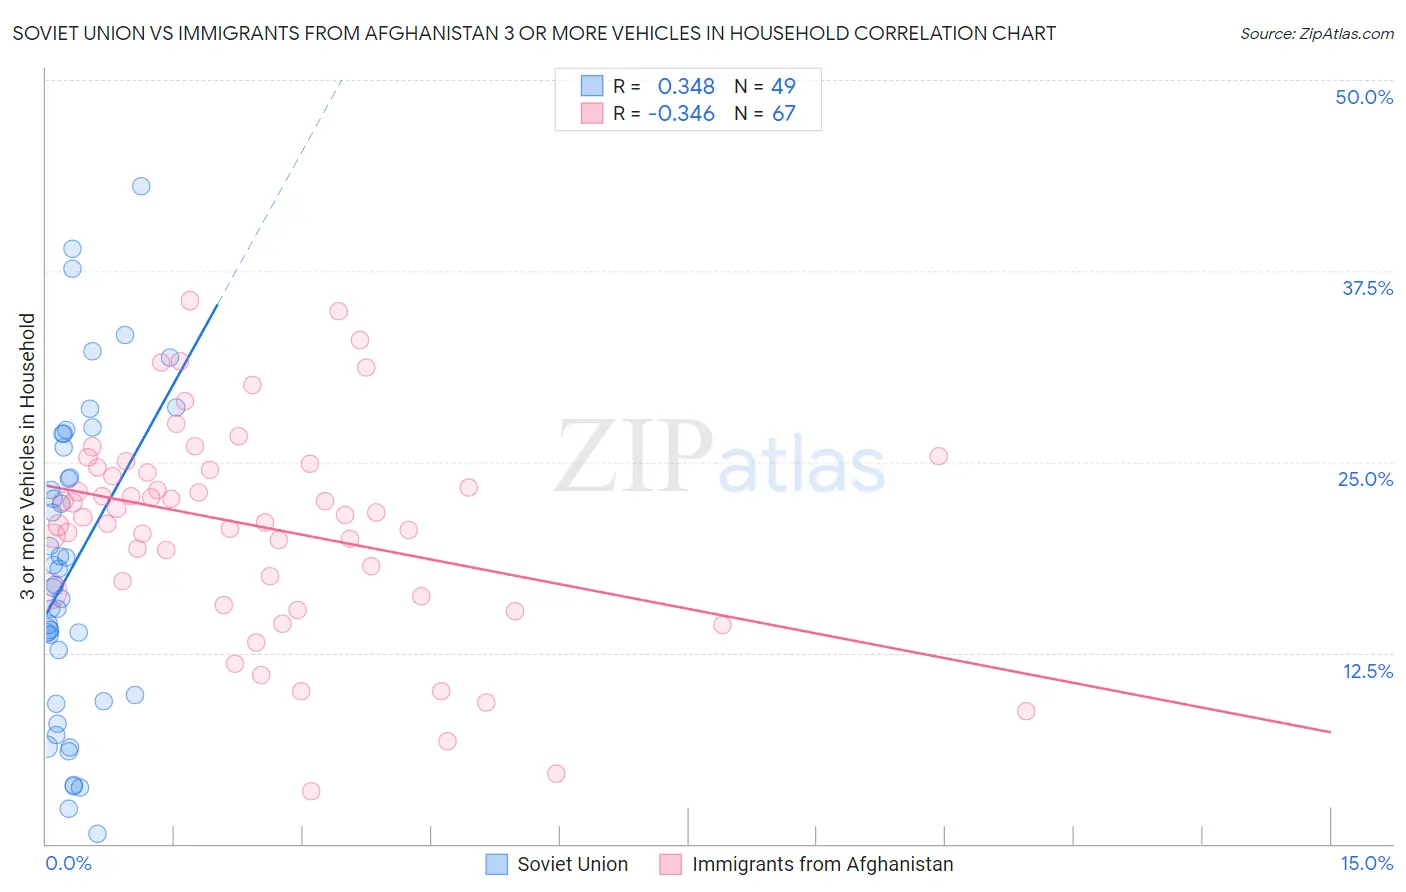
Soviet Union vs Immigrants from Afghanistan 3 or more Vehicles in Household Correlation Chart

The statistical analysis conducted on geographies consisting of 43,505,589 people shows a mild positive correlation between the proportion of Soviet Union and percentage of households with 3 or more vehicles available in the United States with a correlation coefficient (R) of 0.348 and weighted average of 14.2%. Similarly, the statistical analysis conducted on geographies consisting of 147,579,076 people shows a mild negative correlation between the proportion of Immigrants from Afghanistan and percentage of households with 3 or more vehicles available in the United States with a correlation coefficient (R) of -0.346 and weighted average of 21.2%, a difference of 49.8%.
Soviet Union vs Immigrants from Afghanistan 3 or more Vehicles in Household

3 or more Vehicles in Household Correlation Summary

MeasurementSoviet UnionImmigrants from Afghanistan
Minimum0.69%3.4%
Maximum43.0%35.6%
Range42.4%32.2%
Mean18.2%20.7%
Median16.9%21.5%
Interquartile 25% (IQ1)9.5%16.5%
Interquartile 75% (IQ3)26.4%24.6%
Interquartile Range (IQR)16.8%8.1%
Standard Deviation (Sample)10.2%6.9%
Standard Deviation (Population)10.1%6.8%

Similar Demographics by 3 or more Vehicles in Household

Demographics Similar to Soviet Union by 3 or more Vehicles in Household

In terms of 3 or more vehicles in household, the demographic groups most similar to Soviet Union are Senegalese (14.2%, a difference of 0.33%), Immigrants from Yemen (14.2%, a difference of 0.41%), Ecuadorian (14.1%, a difference of 0.89%), Immigrants from Albania (14.0%, a difference of 1.6%), and Immigrants from Caribbean (14.6%, a difference of 2.7%).
DemographicsRating | Rank3 or more Vehicles in Household
Cape Verdeans
0.0
/100
|
#319
Tragic
15.0%
Yup'ik
0.0
/100
|
#320
Tragic
14.8%
Immigrants | Jamaica
0.0
/100
|
#321
Tragic
14.7%
Immigrants | West Indies
0.0
/100
|
#322
Tragic
14.6%
Immigrants | Caribbean
0.0
/100
|
#323
Tragic
14.6%
Immigrants | Yemen
0.0
/100
|
#324
Tragic
14.2%
Senegalese
0.0
/100
|
#325
Tragic
14.2%
Soviet Union
0.0
/100
|
#326
Tragic
14.2%
Ecuadorians
0.0
/100
|
#327
Tragic
14.1%
Immigrants | Albania
0.0
/100
|
#328
Tragic
14.0%
Immigrants | Senegal
0.0
/100
|
#329
Tragic
13.8%
West Indians
0.0
/100
|
#330
Tragic
13.7%
Immigrants | Dominica
0.0
/100
|
#331
Tragic
13.7%
Trinidadians and Tobagonians
0.0
/100
|
#332
Tragic
13.6%
Immigrants | Cabo Verde
0.0
/100
|
#333
Tragic
13.6%

Demographics Similar to Immigrants from Afghanistan by 3 or more Vehicles in Household

In terms of 3 or more vehicles in household, the demographic groups most similar to Immigrants from Afghanistan are Marshallese (21.3%, a difference of 0.22%), Belgian (21.2%, a difference of 0.33%), Apache (21.2%, a difference of 0.41%), Immigrants from Indonesia (21.1%, a difference of 0.61%), and French (21.4%, a difference of 0.78%).
DemographicsRating | Rank3 or more Vehicles in Household
Chippewa
99.6
/100
|
#83
Exceptional
21.5%
Icelanders
99.6
/100
|
#84
Exceptional
21.5%
Laotians
99.6
/100
|
#85
Exceptional
21.5%
Delaware
99.6
/100
|
#86
Exceptional
21.5%
Immigrants | Azores
99.5
/100
|
#87
Exceptional
21.5%
French
99.4
/100
|
#88
Exceptional
21.4%
Marshallese
99.2
/100
|
#89
Exceptional
21.3%
Immigrants | Afghanistan
99.1
/100
|
#90
Exceptional
21.2%
Belgians
98.9
/100
|
#91
Exceptional
21.2%
Apache
98.9
/100
|
#92
Exceptional
21.2%
Immigrants | Indonesia
98.8
/100
|
#93
Exceptional
21.1%
Immigrants | Cambodia
98.6
/100
|
#94
Exceptional
21.1%
Pakistanis
98.5
/100
|
#95
Exceptional
21.0%
Cree
98.4
/100
|
#96
Exceptional
21.0%
Canadians
98.3
/100
|
#97
Exceptional
21.0%