Turkish vs Immigrants from Afghanistan Male Unemployment
COMPARE
Turkish
Immigrants from Afghanistan
Male Unemployment
Male Unemployment Comparison
Turks
Immigrants from Afghanistan
5.0%
MALE UNEMPLOYMENT
98.5/ 100
METRIC RATING
57th/ 347
METRIC RANK
5.3%
MALE UNEMPLOYMENT
37.9/ 100
METRIC RATING
181st/ 347
METRIC RANK
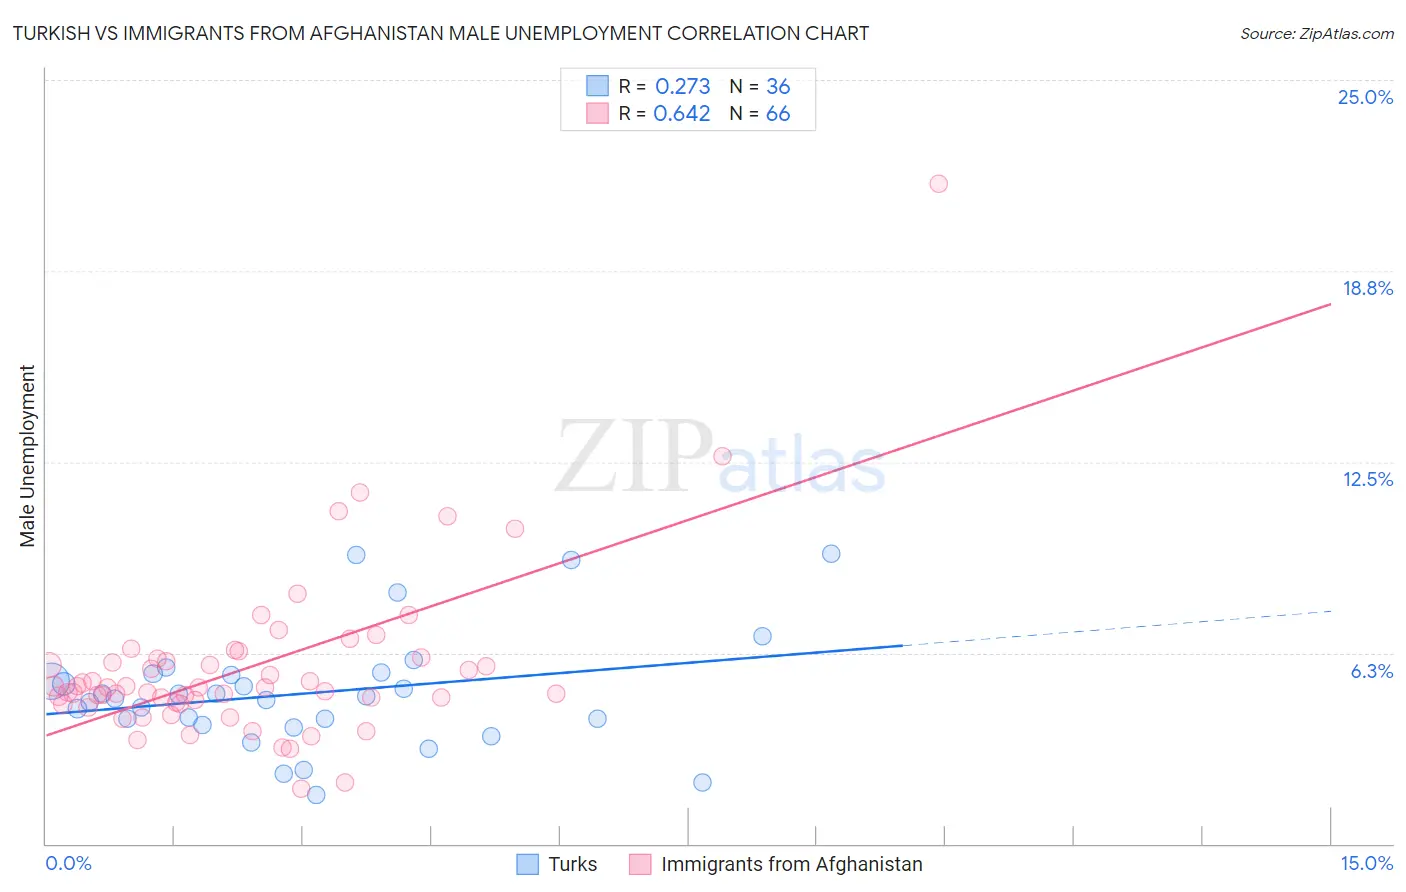
Turkish vs Immigrants from Afghanistan Male Unemployment Correlation Chart
The statistical analysis conducted on geographies consisting of 271,353,998 people shows a weak positive correlation between the proportion of Turks and unemployment rate among males in the United States with a correlation coefficient (R) of 0.273 and weighted average of 5.0%. Similarly, the statistical analysis conducted on geographies consisting of 147,586,191 people shows a significant positive correlation between the proportion of Immigrants from Afghanistan and unemployment rate among males in the United States with a correlation coefficient (R) of 0.642 and weighted average of 5.3%, a difference of 7.3%.
Male Unemployment Correlation Summary
| Measurement | Turkish | Immigrants from Afghanistan |
| Minimum | 1.6% | 1.8% |
| Maximum | 9.5% | 21.6% |
| Range | 7.9% | 19.8% |
| Mean | 4.9% | 5.8% |
| Median | 4.8% | 5.1% |
| Interquartile 25% (IQ1) | 4.0% | 4.6% |
| Interquartile 75% (IQ3) | 5.5% | 6.0% |
| Interquartile Range (IQR) | 1.6% | 1.4% |
| Standard Deviation (Sample) | 1.9% | 2.8% |
| Standard Deviation (Population) | 1.9% | 2.8% |
Similar Demographics by Male Unemployment
Demographics Similar to Turks by Male Unemployment
In terms of male unemployment, the demographic groups most similar to Turks are Lithuanian (5.0%, a difference of 0.0%), Immigrants from Netherlands (5.0%, a difference of 0.14%), Immigrants from Bulgaria (5.0%, a difference of 0.23%), Yugoslavian (5.0%, a difference of 0.24%), and Czechoslovakian (5.0%, a difference of 0.24%).
| Demographics | Rating | Rank | Male Unemployment |
| Croatians | 98.9 /100 | #50 | Exceptional 4.9% |
| Slovenes | 98.8 /100 | #51 | Exceptional 5.0% |
| Irish | 98.8 /100 | #52 | Exceptional 5.0% |
| Jordanians | 98.8 /100 | #53 | Exceptional 5.0% |
| Yugoslavians | 98.7 /100 | #54 | Exceptional 5.0% |
| Czechoslovakians | 98.7 /100 | #55 | Exceptional 5.0% |
| Immigrants | Bulgaria | 98.7 /100 | #56 | Exceptional 5.0% |
| Turks | 98.5 /100 | #57 | Exceptional 5.0% |
| Lithuanians | 98.5 /100 | #58 | Exceptional 5.0% |
| Immigrants | Netherlands | 98.3 /100 | #59 | Exceptional 5.0% |
| Immigrants | Argentina | 98.1 /100 | #60 | Exceptional 5.0% |
| Cambodians | 98.1 /100 | #61 | Exceptional 5.0% |
| Basques | 97.9 /100 | #62 | Exceptional 5.0% |
| Eastern Europeans | 97.9 /100 | #63 | Exceptional 5.0% |
| Celtics | 97.8 /100 | #64 | Exceptional 5.0% |
Demographics Similar to Immigrants from Afghanistan by Male Unemployment
In terms of male unemployment, the demographic groups most similar to Immigrants from Afghanistan are Potawatomi (5.3%, a difference of 0.010%), Taiwanese (5.3%, a difference of 0.020%), Malaysian (5.3%, a difference of 0.10%), Immigrants from Oceania (5.3%, a difference of 0.18%), and Spaniard (5.3%, a difference of 0.18%).
| Demographics | Rating | Rank | Male Unemployment |
| Immigrants | Iran | 50.0 /100 | #174 | Average 5.3% |
| Immigrants | Iraq | 48.1 /100 | #175 | Average 5.3% |
| Immigrants | Poland | 46.0 /100 | #176 | Average 5.3% |
| Immigrants | Peru | 44.6 /100 | #177 | Average 5.3% |
| Osage | 42.5 /100 | #178 | Average 5.3% |
| Immigrants | Oceania | 40.8 /100 | #179 | Average 5.3% |
| Malaysians | 39.6 /100 | #180 | Fair 5.3% |
| Immigrants | Afghanistan | 37.9 /100 | #181 | Fair 5.3% |
| Potawatomi | 37.8 /100 | #182 | Fair 5.3% |
| Taiwanese | 37.6 /100 | #183 | Fair 5.3% |
| Spaniards | 35.1 /100 | #184 | Fair 5.3% |
| Koreans | 34.9 /100 | #185 | Fair 5.3% |
| Iraqis | 31.6 /100 | #186 | Fair 5.4% |
| Costa Ricans | 31.3 /100 | #187 | Fair 5.4% |
| Arabs | 30.2 /100 | #188 | Fair 5.4% |