Marshallese vs Immigrants from Western Europe 3 or more Vehicles in Household
COMPARE
Marshallese
Immigrants from Western Europe
3 or more Vehicles in Household
3 or more Vehicles in Household Comparison
Marshallese
Immigrants from Western Europe
21.3%
3 OR MORE VEHICLES IN HOUSEHOLD
99.2/ 100
METRIC RATING
89th/ 347
METRIC RANK
19.5%
3 OR MORE VEHICLES IN HOUSEHOLD
53.2/ 100
METRIC RATING
171st/ 347
METRIC RANK
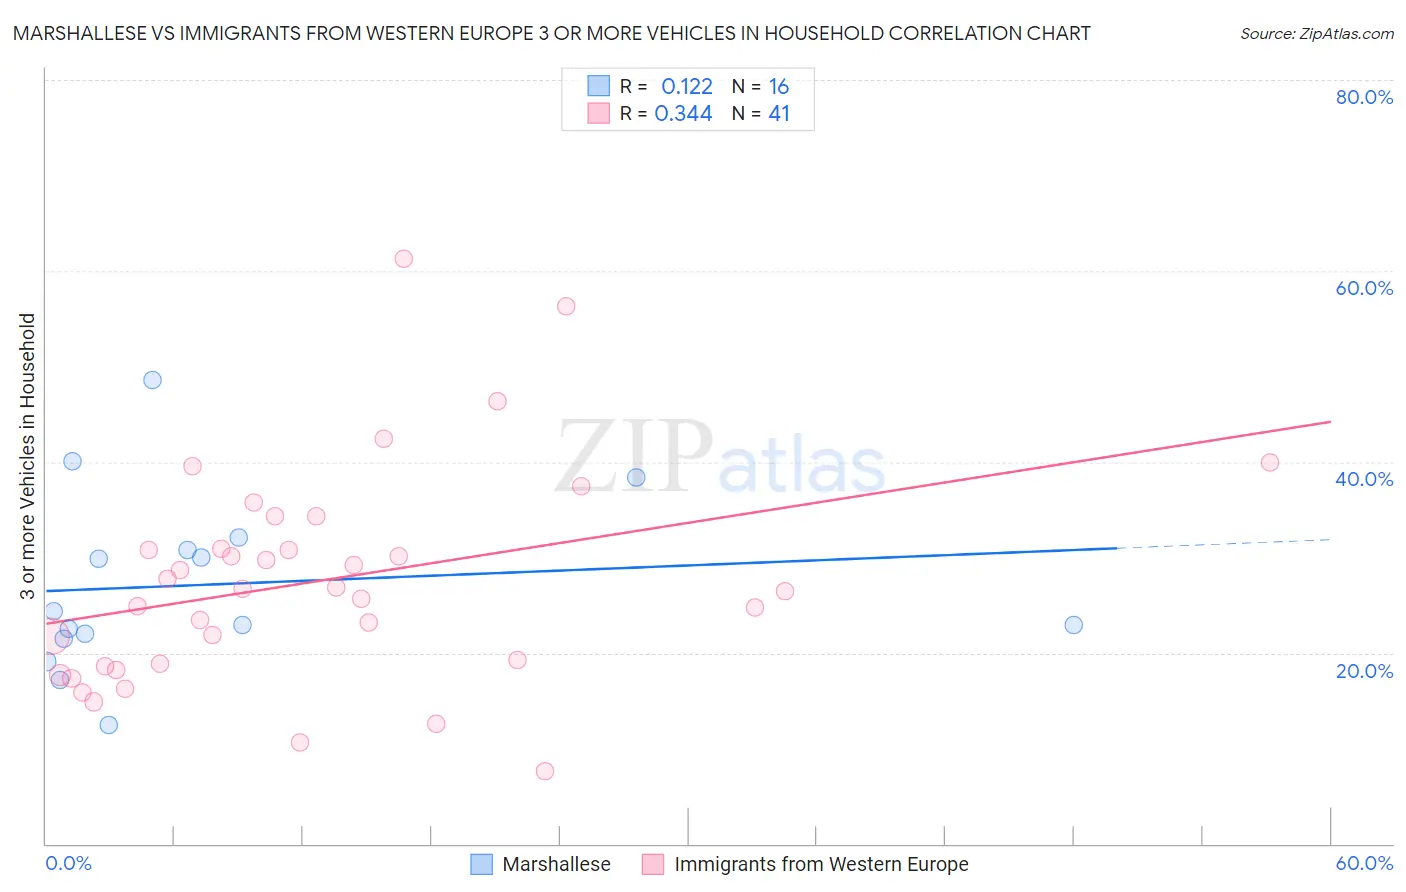
Marshallese vs Immigrants from Western Europe 3 or more Vehicles in Household Correlation Chart
The statistical analysis conducted on geographies consisting of 14,761,315 people shows a poor positive correlation between the proportion of Marshallese and percentage of households with 3 or more vehicles available in the United States with a correlation coefficient (R) of 0.122 and weighted average of 21.3%. Similarly, the statistical analysis conducted on geographies consisting of 493,637,379 people shows a mild positive correlation between the proportion of Immigrants from Western Europe and percentage of households with 3 or more vehicles available in the United States with a correlation coefficient (R) of 0.344 and weighted average of 19.5%, a difference of 8.9%.
3 or more Vehicles in Household Correlation Summary
| Measurement | Marshallese | Immigrants from Western Europe |
| Minimum | 12.4% | 7.5% |
| Maximum | 48.6% | 61.3% |
| Range | 36.2% | 53.7% |
| Mean | 27.2% | 27.5% |
| Median | 23.7% | 26.7% |
| Interquartile 25% (IQ1) | 21.8% | 18.7% |
| Interquartile 75% (IQ3) | 31.4% | 32.6% |
| Interquartile Range (IQR) | 9.6% | 13.9% |
| Standard Deviation (Sample) | 9.3% | 11.3% |
| Standard Deviation (Population) | 9.0% | 11.2% |
Similar Demographics by 3 or more Vehicles in Household
Demographics Similar to Marshallese by 3 or more Vehicles in Household
In terms of 3 or more vehicles in household, the demographic groups most similar to Marshallese are Immigrants from Afghanistan (21.2%, a difference of 0.22%), Belgian (21.2%, a difference of 0.55%), French (21.4%, a difference of 0.56%), Apache (21.2%, a difference of 0.63%), and Immigrants from the Azores (21.5%, a difference of 0.82%).
| Demographics | Rating | Rank | 3 or more Vehicles in Household |
| Immigrants | El Salvador | 99.6 /100 | #82 | Exceptional 21.5% |
| Chippewa | 99.6 /100 | #83 | Exceptional 21.5% |
| Icelanders | 99.6 /100 | #84 | Exceptional 21.5% |
| Laotians | 99.6 /100 | #85 | Exceptional 21.5% |
| Delaware | 99.6 /100 | #86 | Exceptional 21.5% |
| Immigrants | Azores | 99.5 /100 | #87 | Exceptional 21.5% |
| French | 99.4 /100 | #88 | Exceptional 21.4% |
| Marshallese | 99.2 /100 | #89 | Exceptional 21.3% |
| Immigrants | Afghanistan | 99.1 /100 | #90 | Exceptional 21.2% |
| Belgians | 98.9 /100 | #91 | Exceptional 21.2% |
| Apache | 98.9 /100 | #92 | Exceptional 21.2% |
| Immigrants | Indonesia | 98.8 /100 | #93 | Exceptional 21.1% |
| Immigrants | Cambodia | 98.6 /100 | #94 | Exceptional 21.1% |
| Pakistanis | 98.5 /100 | #95 | Exceptional 21.0% |
| Cree | 98.4 /100 | #96 | Exceptional 21.0% |
Demographics Similar to Immigrants from Western Europe by 3 or more Vehicles in Household
In terms of 3 or more vehicles in household, the demographic groups most similar to Immigrants from Western Europe are Kiowa (19.5%, a difference of 0.18%), Iraqi (19.6%, a difference of 0.21%), Immigrants from Northern Europe (19.5%, a difference of 0.23%), Immigrants from South Africa (19.5%, a difference of 0.24%), and Immigrants from Denmark (19.6%, a difference of 0.34%).
| Demographics | Rating | Rank | 3 or more Vehicles in Household |
| Yugoslavians | 62.9 /100 | #164 | Good 19.7% |
| Immigrants | Costa Rica | 61.9 /100 | #165 | Good 19.7% |
| Immigrants | Cameroon | 60.9 /100 | #166 | Good 19.7% |
| Ukrainians | 58.9 /100 | #167 | Average 19.6% |
| Peruvians | 58.8 /100 | #168 | Average 19.6% |
| Immigrants | Denmark | 57.6 /100 | #169 | Average 19.6% |
| Iraqis | 56.0 /100 | #170 | Average 19.6% |
| Immigrants | Western Europe | 53.2 /100 | #171 | Average 19.5% |
| Kiowa | 50.9 /100 | #172 | Average 19.5% |
| Immigrants | Northern Europe | 50.2 /100 | #173 | Average 19.5% |
| Immigrants | South Africa | 50.0 /100 | #174 | Average 19.5% |
| Syrians | 47.0 /100 | #175 | Average 19.5% |
| Iroquois | 46.0 /100 | #176 | Average 19.4% |
| Immigrants | Peru | 41.1 /100 | #177 | Average 19.4% |
| Immigrants | Syria | 40.3 /100 | #178 | Average 19.4% |