Colombian vs Immigrants from Western Europe 3 or more Vehicles in Household
COMPARE
Colombian
Immigrants from Western Europe
3 or more Vehicles in Household
3 or more Vehicles in Household Comparison
Colombians
Immigrants from Western Europe
17.8%
3 OR MORE VEHICLES IN HOUSEHOLD
0.9/ 100
METRIC RATING
262nd/ 347
METRIC RANK
19.5%
3 OR MORE VEHICLES IN HOUSEHOLD
53.2/ 100
METRIC RATING
171st/ 347
METRIC RANK
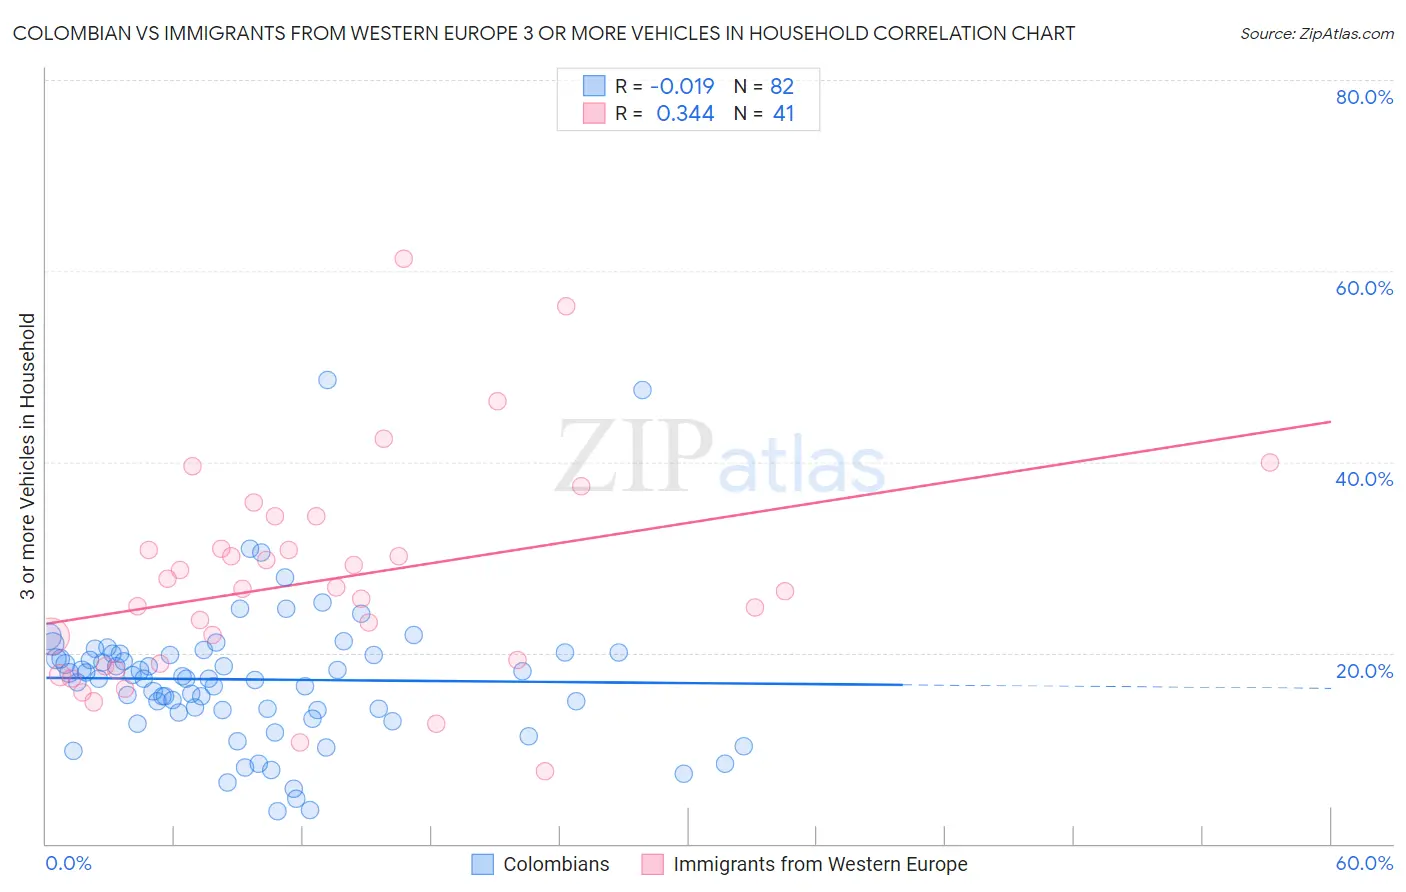
Colombian vs Immigrants from Western Europe 3 or more Vehicles in Household Correlation Chart
The statistical analysis conducted on geographies consisting of 419,151,305 people shows no correlation between the proportion of Colombians and percentage of households with 3 or more vehicles available in the United States with a correlation coefficient (R) of -0.019 and weighted average of 17.8%. Similarly, the statistical analysis conducted on geographies consisting of 493,637,379 people shows a mild positive correlation between the proportion of Immigrants from Western Europe and percentage of households with 3 or more vehicles available in the United States with a correlation coefficient (R) of 0.344 and weighted average of 19.5%, a difference of 10.0%.
3 or more Vehicles in Household Correlation Summary
| Measurement | Colombian | Immigrants from Western Europe |
| Minimum | 3.4% | 7.5% |
| Maximum | 48.6% | 61.3% |
| Range | 45.2% | 53.7% |
| Mean | 17.2% | 27.5% |
| Median | 17.3% | 26.7% |
| Interquartile 25% (IQ1) | 13.9% | 18.7% |
| Interquartile 75% (IQ3) | 19.8% | 32.6% |
| Interquartile Range (IQR) | 5.9% | 13.9% |
| Standard Deviation (Sample) | 7.4% | 11.3% |
| Standard Deviation (Population) | 7.3% | 11.2% |
Similar Demographics by 3 or more Vehicles in Household
Demographics Similar to Colombians by 3 or more Vehicles in Household
In terms of 3 or more vehicles in household, the demographic groups most similar to Colombians are Immigrants from Northern Africa (17.8%, a difference of 0.030%), Ugandan (17.8%, a difference of 0.050%), Bermudan (17.8%, a difference of 0.11%), Cambodian (17.8%, a difference of 0.14%), and Uruguayan (17.8%, a difference of 0.18%).
| Demographics | Rating | Rank | 3 or more Vehicles in Household |
| Immigrants | Turkey | 1.2 /100 | #255 | Tragic 17.9% |
| Sub-Saharan Africans | 1.1 /100 | #256 | Tragic 17.9% |
| Immigrants | Eritrea | 1.1 /100 | #257 | Tragic 17.8% |
| Sudanese | 1.1 /100 | #258 | Tragic 17.8% |
| Uruguayans | 1.0 /100 | #259 | Tragic 17.8% |
| Ugandans | 0.9 /100 | #260 | Tragic 17.8% |
| Immigrants | Northern Africa | 0.9 /100 | #261 | Tragic 17.8% |
| Colombians | 0.9 /100 | #262 | Tragic 17.8% |
| Bermudans | 0.9 /100 | #263 | Tragic 17.8% |
| Cambodians | 0.9 /100 | #264 | Tragic 17.8% |
| Immigrants | Panama | 0.8 /100 | #265 | Tragic 17.7% |
| Macedonians | 0.8 /100 | #266 | Tragic 17.7% |
| Immigrants | Venezuela | 0.8 /100 | #267 | Tragic 17.7% |
| Immigrants | Bulgaria | 0.8 /100 | #268 | Tragic 17.7% |
| Immigrants | France | 0.6 /100 | #269 | Tragic 17.6% |
Demographics Similar to Immigrants from Western Europe by 3 or more Vehicles in Household
In terms of 3 or more vehicles in household, the demographic groups most similar to Immigrants from Western Europe are Kiowa (19.5%, a difference of 0.18%), Iraqi (19.6%, a difference of 0.21%), Immigrants from Northern Europe (19.5%, a difference of 0.23%), Immigrants from South Africa (19.5%, a difference of 0.24%), and Immigrants from Denmark (19.6%, a difference of 0.34%).
| Demographics | Rating | Rank | 3 or more Vehicles in Household |
| Yugoslavians | 62.9 /100 | #164 | Good 19.7% |
| Immigrants | Costa Rica | 61.9 /100 | #165 | Good 19.7% |
| Immigrants | Cameroon | 60.9 /100 | #166 | Good 19.7% |
| Ukrainians | 58.9 /100 | #167 | Average 19.6% |
| Peruvians | 58.8 /100 | #168 | Average 19.6% |
| Immigrants | Denmark | 57.6 /100 | #169 | Average 19.6% |
| Iraqis | 56.0 /100 | #170 | Average 19.6% |
| Immigrants | Western Europe | 53.2 /100 | #171 | Average 19.5% |
| Kiowa | 50.9 /100 | #172 | Average 19.5% |
| Immigrants | Northern Europe | 50.2 /100 | #173 | Average 19.5% |
| Immigrants | South Africa | 50.0 /100 | #174 | Average 19.5% |
| Syrians | 47.0 /100 | #175 | Average 19.5% |
| Iroquois | 46.0 /100 | #176 | Average 19.4% |
| Immigrants | Peru | 41.1 /100 | #177 | Average 19.4% |
| Immigrants | Syria | 40.3 /100 | #178 | Average 19.4% |