Tlingit-Haida vs Immigrants from Ireland Hearing Disability
COMPARE
Tlingit-Haida
Immigrants from Ireland
Hearing Disability
Hearing Disability Comparison
Tlingit-Haida
Immigrants from Ireland
4.8%
HEARING DISABILITY
0.0/ 100
METRIC RATING
344th/ 347
METRIC RANK
3.0%
HEARING DISABILITY
37.4/ 100
METRIC RATING
184th/ 347
METRIC RANK
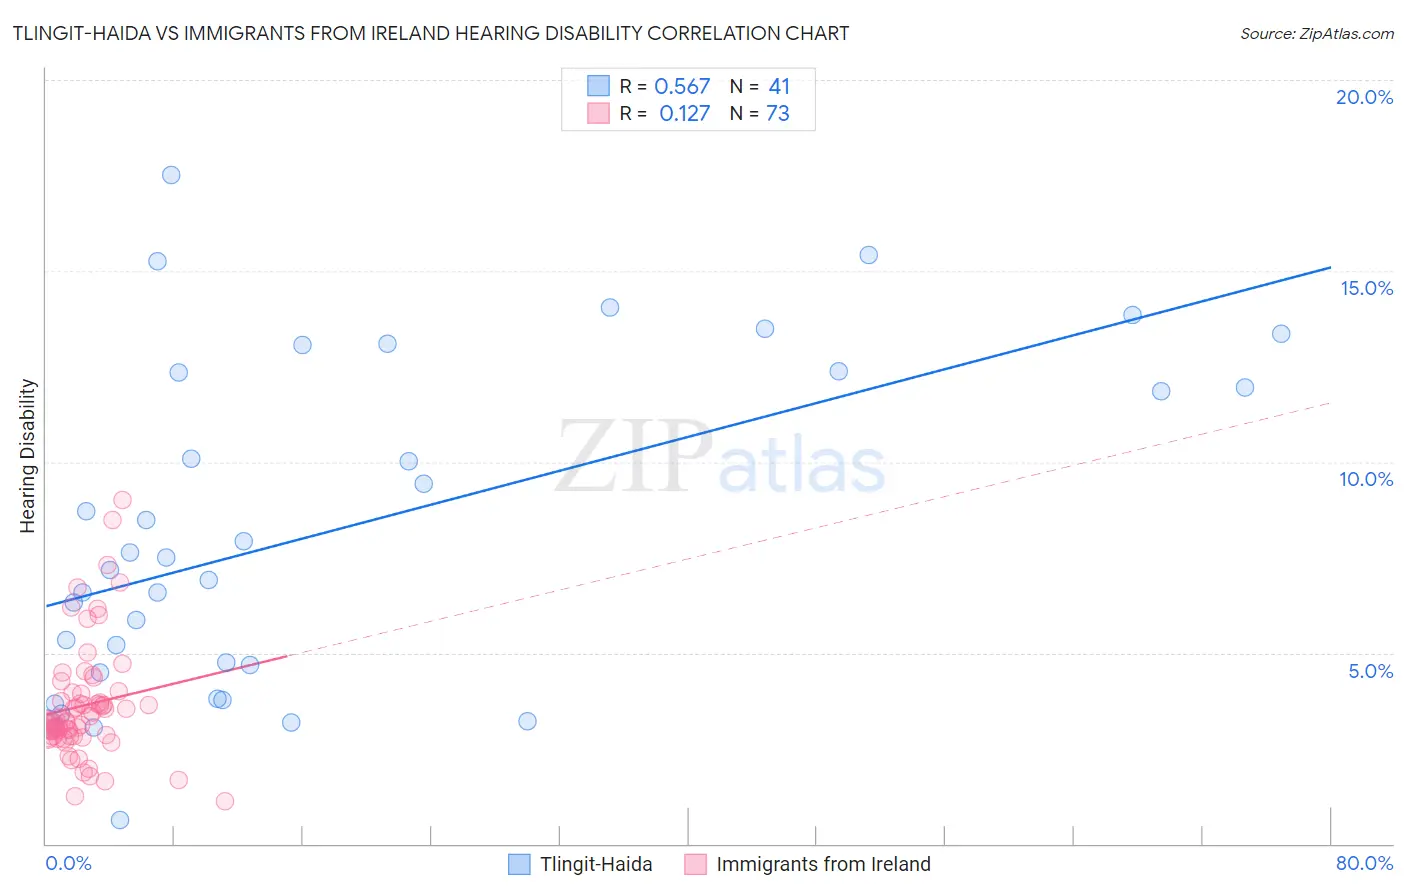
Tlingit-Haida vs Immigrants from Ireland Hearing Disability Correlation Chart
The statistical analysis conducted on geographies consisting of 60,852,790 people shows a substantial positive correlation between the proportion of Tlingit-Haida and percentage of population with hearing disability in the United States with a correlation coefficient (R) of 0.567 and weighted average of 4.8%. Similarly, the statistical analysis conducted on geographies consisting of 240,758,796 people shows a poor positive correlation between the proportion of Immigrants from Ireland and percentage of population with hearing disability in the United States with a correlation coefficient (R) of 0.127 and weighted average of 3.0%, a difference of 59.8%.
Hearing Disability Correlation Summary
| Measurement | Tlingit-Haida | Immigrants from Ireland |
| Minimum | 0.61% | 1.1% |
| Maximum | 17.5% | 9.0% |
| Range | 16.9% | 7.9% |
| Mean | 8.3% | 3.6% |
| Median | 7.5% | 3.2% |
| Interquartile 25% (IQ1) | 4.6% | 2.8% |
| Interquartile 75% (IQ3) | 12.4% | 3.9% |
| Interquartile Range (IQR) | 7.8% | 1.1% |
| Standard Deviation (Sample) | 4.3% | 1.5% |
| Standard Deviation (Population) | 4.3% | 1.5% |
Similar Demographics by Hearing Disability
Demographics Similar to Tlingit-Haida by Hearing Disability
In terms of hearing disability, the demographic groups most similar to Tlingit-Haida are Inupiat (4.7%, a difference of 2.7%), Tsimshian (4.7%, a difference of 2.9%), Navajo (4.6%, a difference of 4.5%), Pueblo (4.6%, a difference of 4.9%), and Choctaw (4.5%, a difference of 6.4%).
| Demographics | Rating | Rank | Hearing Disability |
| Dutch West Indians | 0.0 /100 | #333 | Tragic 4.3% |
| Aleuts | 0.0 /100 | #334 | Tragic 4.3% |
| Kiowa | 0.0 /100 | #335 | Tragic 4.3% |
| Creek | 0.0 /100 | #336 | Tragic 4.4% |
| Chickasaw | 0.0 /100 | #337 | Tragic 4.5% |
| Alaska Natives | 0.0 /100 | #338 | Tragic 4.5% |
| Choctaw | 0.0 /100 | #339 | Tragic 4.5% |
| Pueblo | 0.0 /100 | #340 | Tragic 4.6% |
| Navajo | 0.0 /100 | #341 | Tragic 4.6% |
| Tsimshian | 0.0 /100 | #342 | Tragic 4.7% |
| Inupiat | 0.0 /100 | #343 | Tragic 4.7% |
| Tlingit-Haida | 0.0 /100 | #344 | Tragic 4.8% |
| Alaskan Athabascans | 0.0 /100 | #345 | Tragic 5.3% |
| Colville | 0.0 /100 | #346 | Tragic 5.3% |
| Yup'ik | 0.0 /100 | #347 | Tragic 5.8% |
Demographics Similar to Immigrants from Ireland by Hearing Disability
In terms of hearing disability, the demographic groups most similar to Immigrants from Ireland are Immigrants from Southern Europe (3.0%, a difference of 0.21%), Bulgarian (3.0%, a difference of 0.23%), Immigrants from Mexico (3.0%, a difference of 0.25%), Black/African American (3.0%, a difference of 0.27%), and Mexican American Indian (3.0%, a difference of 0.27%).
| Demographics | Rating | Rank | Hearing Disability |
| Immigrants | Philippines | 46.4 /100 | #177 | Average 3.0% |
| Japanese | 46.0 /100 | #178 | Average 3.0% |
| Immigrants | Moldova | 43.1 /100 | #179 | Average 3.0% |
| Immigrants | Sweden | 42.4 /100 | #180 | Average 3.0% |
| Immigrants | Belgium | 41.5 /100 | #181 | Average 3.0% |
| Immigrants | Italy | 41.1 /100 | #182 | Average 3.0% |
| Bulgarians | 39.7 /100 | #183 | Fair 3.0% |
| Immigrants | Ireland | 37.4 /100 | #184 | Fair 3.0% |
| Immigrants | Southern Europe | 35.3 /100 | #185 | Fair 3.0% |
| Immigrants | Mexico | 34.9 /100 | #186 | Fair 3.0% |
| Blacks/African Americans | 34.7 /100 | #187 | Fair 3.0% |
| Mexican American Indians | 34.7 /100 | #188 | Fair 3.0% |
| Africans | 32.9 /100 | #189 | Fair 3.0% |
| Immigrants | South Africa | 31.1 /100 | #190 | Fair 3.1% |
| Immigrants | Switzerland | 28.8 /100 | #191 | Fair 3.1% |