Sudanese vs Immigrants from Latin America Associate's Degree
COMPARE
Sudanese
Immigrants from Latin America
Associate's Degree
Associate's Degree Comparison
Sudanese
Immigrants from Latin America
47.1%
ASSOCIATE'S DEGREE
70.3/ 100
METRIC RATING
157th/ 347
METRIC RANK
37.9%
ASSOCIATE'S DEGREE
0.0/ 100
METRIC RATING
311th/ 347
METRIC RANK
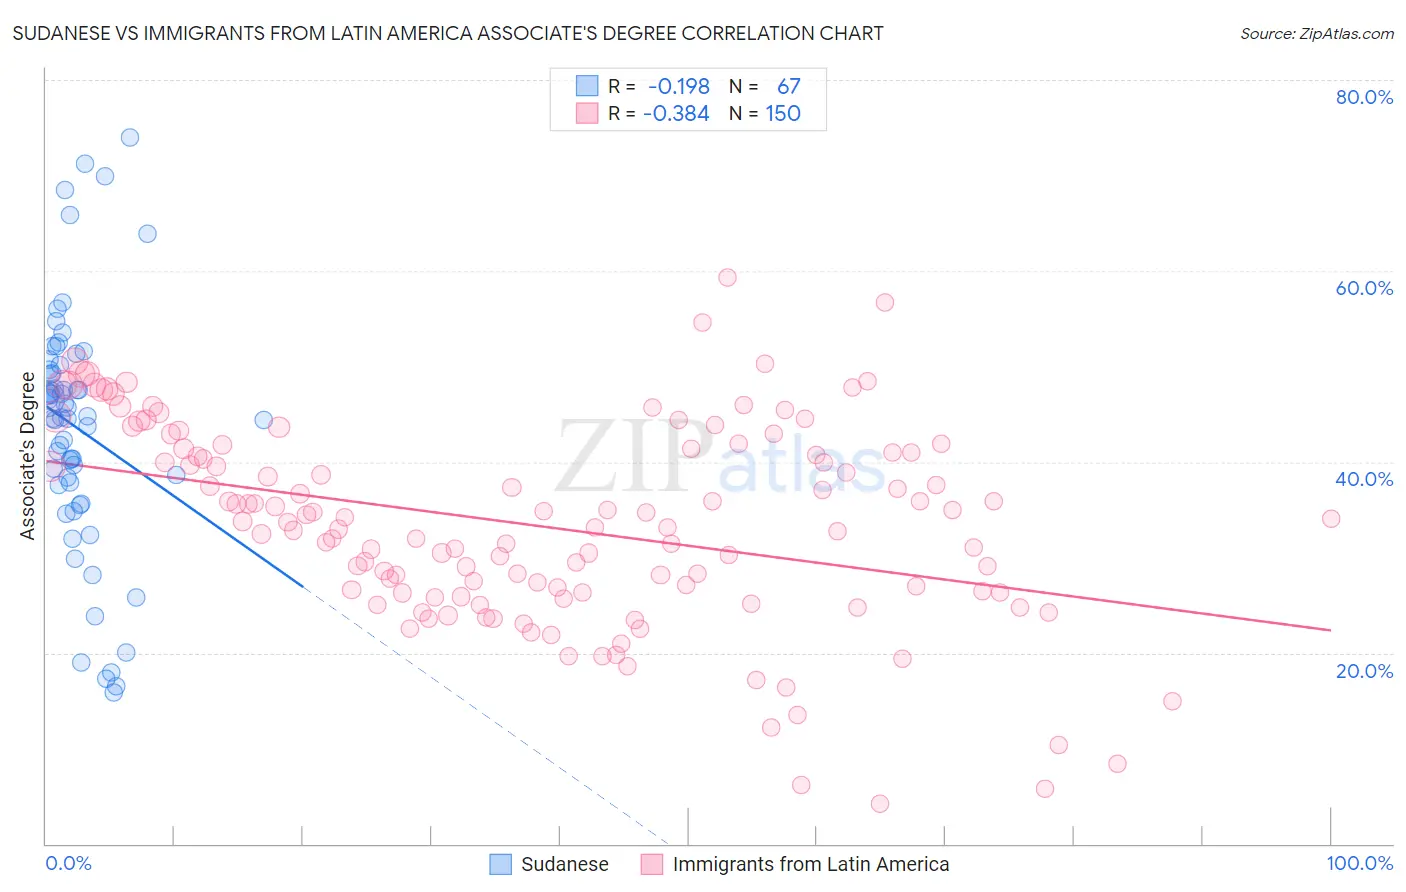
Sudanese vs Immigrants from Latin America Associate's Degree Correlation Chart
The statistical analysis conducted on geographies consisting of 110,144,981 people shows a poor negative correlation between the proportion of Sudanese and percentage of population with at least associate's degree education in the United States with a correlation coefficient (R) of -0.198 and weighted average of 47.1%. Similarly, the statistical analysis conducted on geographies consisting of 558,543,762 people shows a mild negative correlation between the proportion of Immigrants from Latin America and percentage of population with at least associate's degree education in the United States with a correlation coefficient (R) of -0.384 and weighted average of 37.9%, a difference of 24.4%.
Associate's Degree Correlation Summary
| Measurement | Sudanese | Immigrants from Latin America |
| Minimum | 15.8% | 4.2% |
| Maximum | 74.0% | 59.3% |
| Range | 58.2% | 55.1% |
| Mean | 43.5% | 33.3% |
| Median | 44.6% | 33.4% |
| Interquartile 25% (IQ1) | 37.6% | 26.3% |
| Interquartile 75% (IQ3) | 50.2% | 41.3% |
| Interquartile Range (IQR) | 12.6% | 15.0% |
| Standard Deviation (Sample) | 12.9% | 10.6% |
| Standard Deviation (Population) | 12.8% | 10.6% |
Similar Demographics by Associate's Degree
Demographics Similar to Sudanese by Associate's Degree
In terms of associate's degree, the demographic groups most similar to Sudanese are South American (47.1%, a difference of 0.020%), Kenyan (47.1%, a difference of 0.030%), Immigrants from Germany (47.1%, a difference of 0.040%), Immigrants from Poland (47.1%, a difference of 0.090%), and Immigrants from Kenya (47.2%, a difference of 0.16%).
| Demographics | Rating | Rank | Associate's Degree |
| Iraqis | 76.2 /100 | #150 | Good 47.4% |
| Immigrants | North Macedonia | 76.0 /100 | #151 | Good 47.4% |
| Immigrants | Afghanistan | 74.3 /100 | #152 | Good 47.3% |
| Czechs | 72.2 /100 | #153 | Good 47.2% |
| Immigrants | Kenya | 72.1 /100 | #154 | Good 47.2% |
| Kenyans | 70.6 /100 | #155 | Good 47.1% |
| South Americans | 70.5 /100 | #156 | Good 47.1% |
| Sudanese | 70.3 /100 | #157 | Good 47.1% |
| Immigrants | Germany | 69.7 /100 | #158 | Good 47.1% |
| Immigrants | Poland | 69.2 /100 | #159 | Good 47.1% |
| Scottish | 65.4 /100 | #160 | Good 46.9% |
| Scandinavians | 65.2 /100 | #161 | Good 46.9% |
| Immigrants | Africa | 63.2 /100 | #162 | Good 46.8% |
| Somalis | 62.5 /100 | #163 | Good 46.8% |
| Colombians | 62.4 /100 | #164 | Good 46.8% |
Demographics Similar to Immigrants from Latin America by Associate's Degree
In terms of associate's degree, the demographic groups most similar to Immigrants from Latin America are Immigrants from Dominican Republic (37.9%, a difference of 0.11%), Choctaw (37.8%, a difference of 0.22%), Hispanic or Latino (37.7%, a difference of 0.37%), Seminole (37.7%, a difference of 0.42%), and Immigrants from Guatemala (38.1%, a difference of 0.73%).
| Demographics | Rating | Rank | Associate's Degree |
| Sioux | 0.0 /100 | #304 | Tragic 38.5% |
| Immigrants | Honduras | 0.0 /100 | #305 | Tragic 38.5% |
| Shoshone | 0.0 /100 | #306 | Tragic 38.4% |
| Immigrants | El Salvador | 0.0 /100 | #307 | Tragic 38.4% |
| Mexican American Indians | 0.0 /100 | #308 | Tragic 38.2% |
| Immigrants | Guatemala | 0.0 /100 | #309 | Tragic 38.1% |
| Immigrants | Dominican Republic | 0.0 /100 | #310 | Tragic 37.9% |
| Immigrants | Latin America | 0.0 /100 | #311 | Tragic 37.9% |
| Choctaw | 0.0 /100 | #312 | Tragic 37.8% |
| Hispanics or Latinos | 0.0 /100 | #313 | Tragic 37.7% |
| Seminole | 0.0 /100 | #314 | Tragic 37.7% |
| Creek | 0.0 /100 | #315 | Tragic 37.6% |
| Crow | 0.0 /100 | #316 | Tragic 37.6% |
| Yaqui | 0.0 /100 | #317 | Tragic 37.6% |
| Alaska Natives | 0.0 /100 | #318 | Tragic 37.5% |