Immigrants from Belize vs Immigrants from Latin America 2 or more Vehicles in Household
COMPARE
Immigrants from Belize
Immigrants from Latin America
2 or more Vehicles in Household
2 or more Vehicles in Household Comparison
Immigrants from Belize
Immigrants from Latin America
49.9%
2 OR MORE VEHICLES IN HOUSEHOLD
0.0/ 100
METRIC RATING
304th/ 347
METRIC RANK
54.3%
2 OR MORE VEHICLES IN HOUSEHOLD
13.1/ 100
METRIC RATING
206th/ 347
METRIC RANK
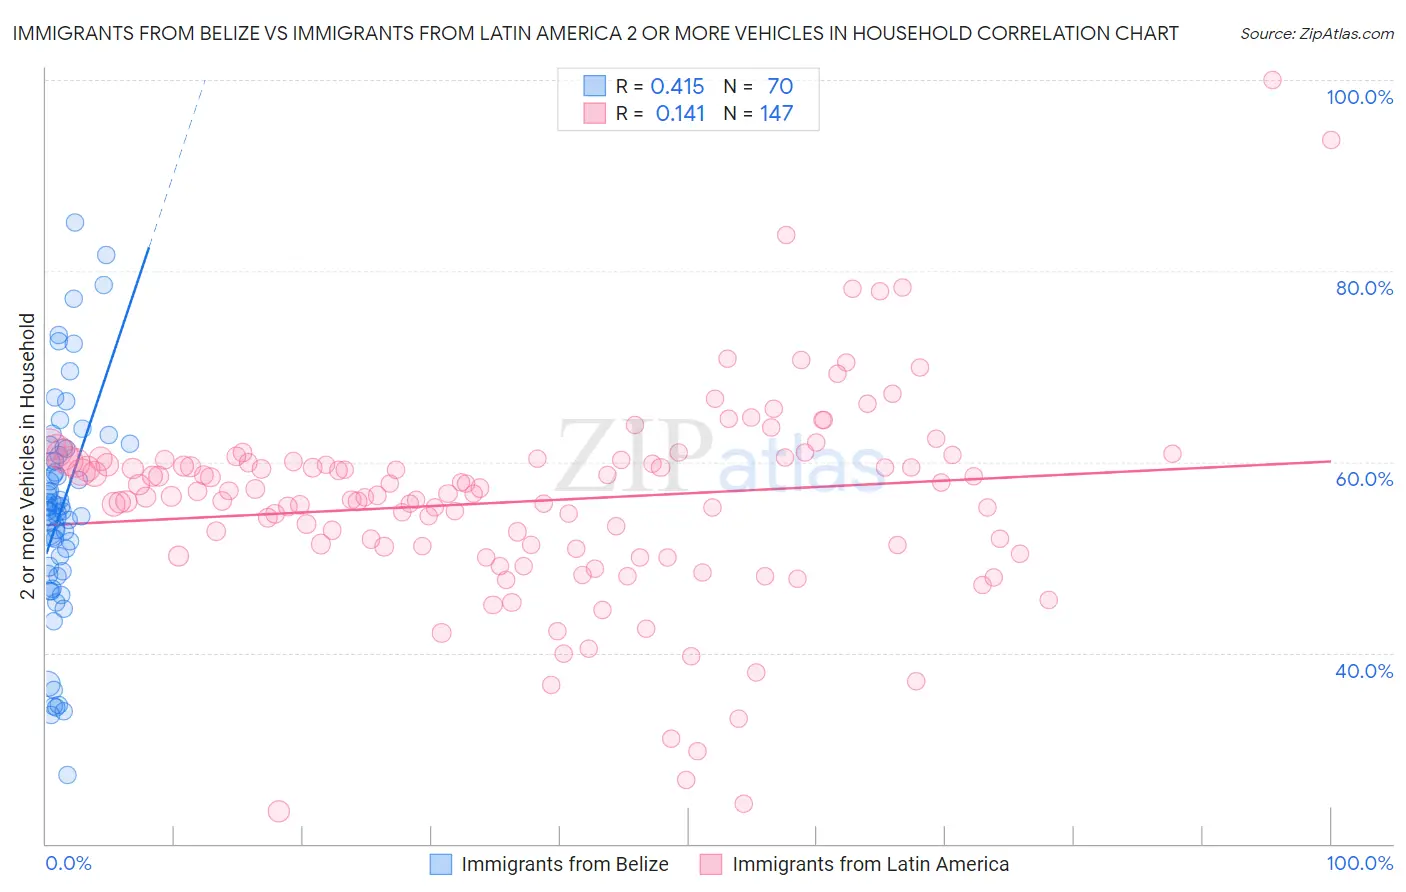
Immigrants from Belize vs Immigrants from Latin America 2 or more Vehicles in Household Correlation Chart
The statistical analysis conducted on geographies consisting of 130,296,303 people shows a moderate positive correlation between the proportion of Immigrants from Belize and percentage of households with 2 or more vehicles available in the United States with a correlation coefficient (R) of 0.415 and weighted average of 49.9%. Similarly, the statistical analysis conducted on geographies consisting of 558,094,451 people shows a poor positive correlation between the proportion of Immigrants from Latin America and percentage of households with 2 or more vehicles available in the United States with a correlation coefficient (R) of 0.141 and weighted average of 54.3%, a difference of 8.8%.
2 or more Vehicles in Household Correlation Summary
| Measurement | Immigrants from Belize | Immigrants from Latin America |
| Minimum | 27.2% | 23.4% |
| Maximum | 85.1% | 100.0% |
| Range | 57.9% | 76.6% |
| Mean | 55.1% | 55.9% |
| Median | 55.1% | 56.7% |
| Interquartile 25% (IQ1) | 48.6% | 51.1% |
| Interquartile 75% (IQ3) | 61.4% | 60.2% |
| Interquartile Range (IQR) | 12.9% | 9.1% |
| Standard Deviation (Sample) | 11.6% | 10.8% |
| Standard Deviation (Population) | 11.5% | 10.7% |
Similar Demographics by 2 or more Vehicles in Household
Demographics Similar to Immigrants from Belize by 2 or more Vehicles in Household
In terms of 2 or more vehicles in household, the demographic groups most similar to Immigrants from Belize are Tohono O'odham (50.0%, a difference of 0.20%), Immigrants from South America (50.2%, a difference of 0.57%), Immigrants from Greece (50.2%, a difference of 0.63%), Immigrants from Russia (50.3%, a difference of 0.81%), and Immigrants from Morocco (50.3%, a difference of 0.85%).
| Demographics | Rating | Rank | 2 or more Vehicles in Household |
| Immigrants | Spain | 0.0 /100 | #297 | Tragic 50.4% |
| Paraguayans | 0.0 /100 | #298 | Tragic 50.3% |
| Immigrants | Morocco | 0.0 /100 | #299 | Tragic 50.3% |
| Immigrants | Russia | 0.0 /100 | #300 | Tragic 50.3% |
| Immigrants | Greece | 0.0 /100 | #301 | Tragic 50.2% |
| Immigrants | South America | 0.0 /100 | #302 | Tragic 50.2% |
| Tohono O'odham | 0.0 /100 | #303 | Tragic 50.0% |
| Immigrants | Belize | 0.0 /100 | #304 | Tragic 49.9% |
| Immigrants | Western Africa | 0.0 /100 | #305 | Tragic 49.4% |
| Immigrants | Israel | 0.0 /100 | #306 | Tragic 49.2% |
| Hopi | 0.0 /100 | #307 | Tragic 49.0% |
| Albanians | 0.0 /100 | #308 | Tragic 49.0% |
| Moroccans | 0.0 /100 | #309 | Tragic 48.8% |
| Ghanaians | 0.0 /100 | #310 | Tragic 48.0% |
| Immigrants | Belarus | 0.0 /100 | #311 | Tragic 47.9% |
Demographics Similar to Immigrants from Latin America by 2 or more Vehicles in Household
In terms of 2 or more vehicles in household, the demographic groups most similar to Immigrants from Latin America are Turkish (54.3%, a difference of 0.010%), Cheyenne (54.3%, a difference of 0.050%), Immigrants from Belgium (54.3%, a difference of 0.060%), Egyptian (54.3%, a difference of 0.10%), and Immigrants from Bulgaria (54.3%, a difference of 0.10%).
| Demographics | Rating | Rank | 2 or more Vehicles in Household |
| Immigrants | Norway | 15.9 /100 | #199 | Poor 54.4% |
| Houma | 15.8 /100 | #200 | Poor 54.4% |
| Immigrants | Italy | 15.5 /100 | #201 | Poor 54.4% |
| Immigrants | North Macedonia | 14.9 /100 | #202 | Poor 54.4% |
| Immigrants | Peru | 14.3 /100 | #203 | Poor 54.4% |
| Immigrants | Belgium | 13.7 /100 | #204 | Poor 54.3% |
| Cheyenne | 13.6 /100 | #205 | Poor 54.3% |
| Immigrants | Latin America | 13.1 /100 | #206 | Poor 54.3% |
| Turks | 13.0 /100 | #207 | Poor 54.3% |
| Egyptians | 12.0 /100 | #208 | Poor 54.3% |
| Immigrants | Bulgaria | 12.0 /100 | #209 | Poor 54.3% |
| Immigrants | Saudi Arabia | 11.3 /100 | #210 | Poor 54.2% |
| Immigrants | Hungary | 11.3 /100 | #211 | Poor 54.2% |
| Immigrants | Chile | 11.1 /100 | #212 | Poor 54.2% |
| Guatemalans | 9.6 /100 | #213 | Tragic 54.1% |