Sudanese vs Immigrants from Latin America Vision Disability
COMPARE
Sudanese
Immigrants from Latin America
Vision Disability
Vision Disability Comparison
Sudanese
Immigrants from Latin America
2.1%
VISION DISABILITY
89.2/ 100
METRIC RATING
127th/ 347
METRIC RANK
2.4%
VISION DISABILITY
0.0/ 100
METRIC RATING
274th/ 347
METRIC RANK
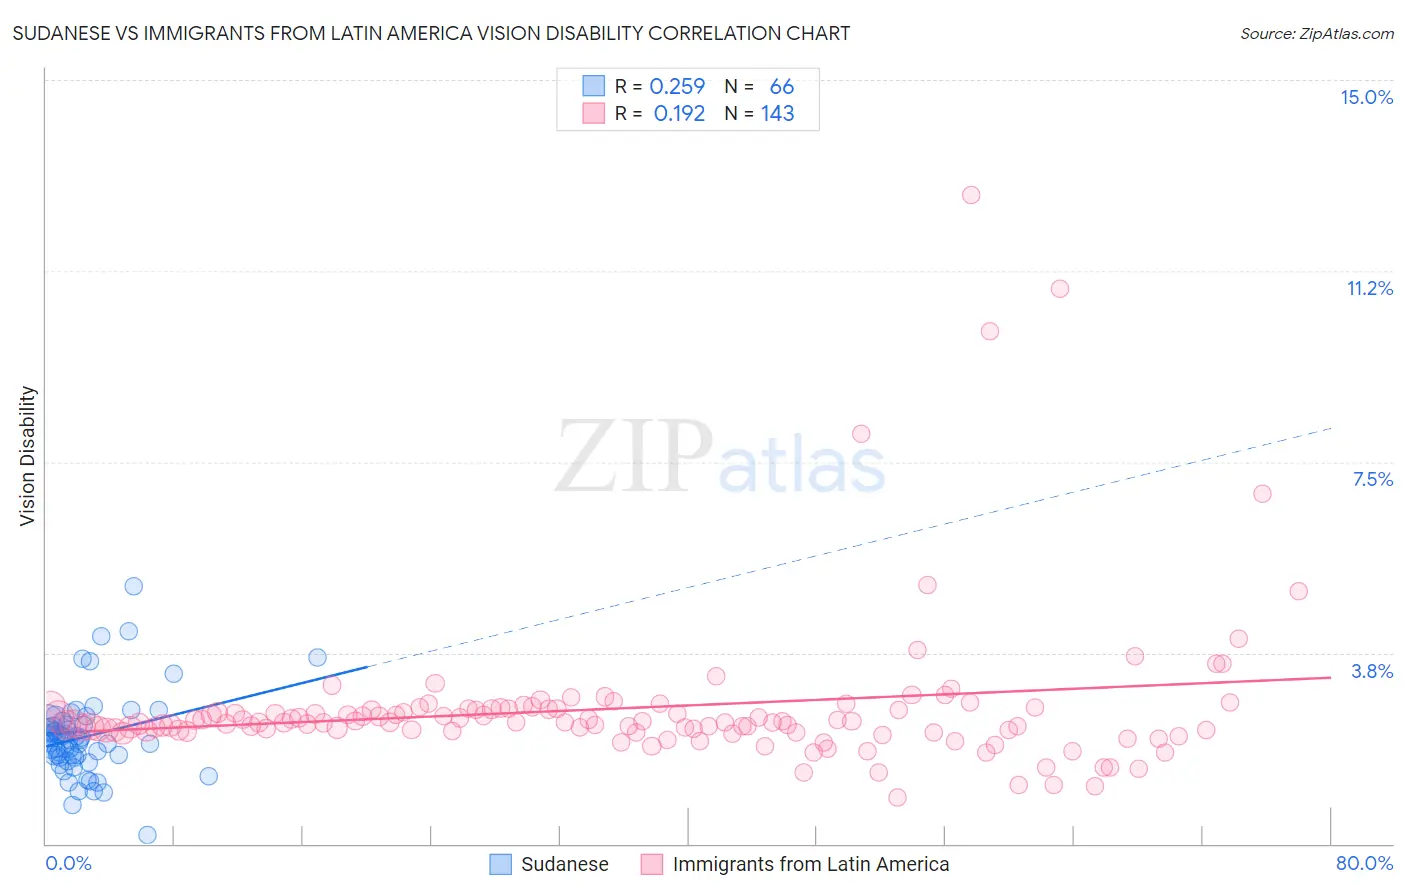
Sudanese vs Immigrants from Latin America Vision Disability Correlation Chart
The statistical analysis conducted on geographies consisting of 110,115,679 people shows a weak positive correlation between the proportion of Sudanese and percentage of population with vision disability in the United States with a correlation coefficient (R) of 0.259 and weighted average of 2.1%. Similarly, the statistical analysis conducted on geographies consisting of 557,074,297 people shows a poor positive correlation between the proportion of Immigrants from Latin America and percentage of population with vision disability in the United States with a correlation coefficient (R) of 0.192 and weighted average of 2.4%, a difference of 16.0%.
Vision Disability Correlation Summary
| Measurement | Sudanese | Immigrants from Latin America |
| Minimum | 0.17% | 0.90% |
| Maximum | 5.1% | 12.7% |
| Range | 4.9% | 11.8% |
| Mean | 2.1% | 2.7% |
| Median | 2.0% | 2.4% |
| Interquartile 25% (IQ1) | 1.7% | 2.2% |
| Interquartile 75% (IQ3) | 2.3% | 2.7% |
| Interquartile Range (IQR) | 0.64% | 0.43% |
| Standard Deviation (Sample) | 0.82% | 1.5% |
| Standard Deviation (Population) | 0.81% | 1.5% |
Similar Demographics by Vision Disability
Demographics Similar to Sudanese by Vision Disability
In terms of vision disability, the demographic groups most similar to Sudanese are Immigrants from Chile (2.1%, a difference of 0.030%), Immigrants from Peru (2.1%, a difference of 0.060%), Immigrants from Cameroon (2.1%, a difference of 0.070%), Immigrants from Kenya (2.1%, a difference of 0.070%), and Immigrants from Hungary (2.1%, a difference of 0.090%).
| Demographics | Rating | Rank | Vision Disability |
| Immigrants | Zimbabwe | 91.0 /100 | #120 | Exceptional 2.1% |
| Immigrants | Scotland | 90.4 /100 | #121 | Exceptional 2.1% |
| Immigrants | Ukraine | 90.4 /100 | #122 | Exceptional 2.1% |
| Immigrants | Albania | 90.4 /100 | #123 | Exceptional 2.1% |
| Immigrants | Spain | 89.8 /100 | #124 | Excellent 2.1% |
| Immigrants | Venezuela | 89.8 /100 | #125 | Excellent 2.1% |
| Immigrants | Peru | 89.5 /100 | #126 | Excellent 2.1% |
| Sudanese | 89.2 /100 | #127 | Excellent 2.1% |
| Immigrants | Chile | 89.0 /100 | #128 | Excellent 2.1% |
| Immigrants | Cameroon | 88.8 /100 | #129 | Excellent 2.1% |
| Immigrants | Kenya | 88.7 /100 | #130 | Excellent 2.1% |
| Immigrants | Hungary | 88.7 /100 | #131 | Excellent 2.1% |
| New Zealanders | 88.2 /100 | #132 | Excellent 2.1% |
| Syrians | 87.5 /100 | #133 | Excellent 2.1% |
| Venezuelans | 87.2 /100 | #134 | Excellent 2.1% |
Demographics Similar to Immigrants from Latin America by Vision Disability
In terms of vision disability, the demographic groups most similar to Immigrants from Latin America are Immigrants from Bahamas (2.4%, a difference of 0.31%), Chippewa (2.4%, a difference of 0.32%), Scotch-Irish (2.4%, a difference of 0.41%), Bahamian (2.4%, a difference of 0.45%), and Spanish (2.4%, a difference of 0.61%).
| Demographics | Rating | Rank | Vision Disability |
| Ute | 0.1 /100 | #267 | Tragic 2.4% |
| Senegalese | 0.1 /100 | #268 | Tragic 2.4% |
| Celtics | 0.1 /100 | #269 | Tragic 2.4% |
| Cubans | 0.1 /100 | #270 | Tragic 2.4% |
| Immigrants | Azores | 0.1 /100 | #271 | Tragic 2.4% |
| Spaniards | 0.1 /100 | #272 | Tragic 2.4% |
| Immigrants | Bahamas | 0.1 /100 | #273 | Tragic 2.4% |
| Immigrants | Latin America | 0.0 /100 | #274 | Tragic 2.4% |
| Chippewa | 0.0 /100 | #275 | Tragic 2.4% |
| Scotch-Irish | 0.0 /100 | #276 | Tragic 2.4% |
| Bahamians | 0.0 /100 | #277 | Tragic 2.4% |
| Spanish | 0.0 /100 | #278 | Tragic 2.4% |
| Nepalese | 0.0 /100 | #279 | Tragic 2.4% |
| Cape Verdeans | 0.0 /100 | #280 | Tragic 2.4% |
| U.S. Virgin Islanders | 0.0 /100 | #281 | Tragic 2.5% |