Subsaharan African vs Alaskan Athabascan No Vehicles in Household
COMPARE
Subsaharan African
Alaskan Athabascan
No Vehicles in Household
No Vehicles in Household Comparison
Sub-Saharan Africans
Alaskan Athabascans
12.2%
NO VEHICLES IN HOUSEHOLD
0.6/ 100
METRIC RATING
261st/ 347
METRIC RANK
15.6%
NO VEHICLES IN HOUSEHOLD
0.0/ 100
METRIC RATING
312th/ 347
METRIC RANK
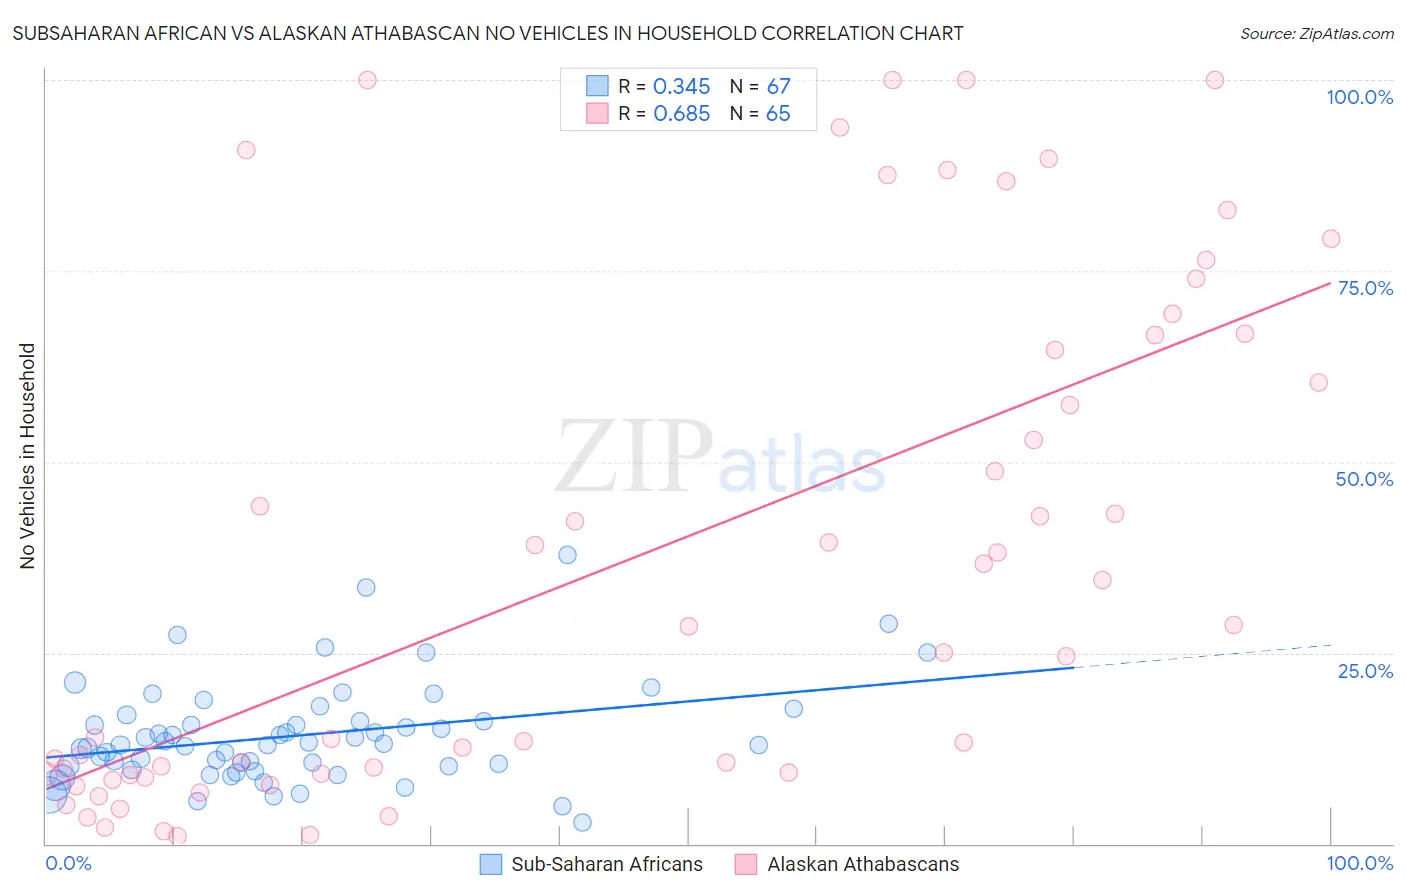
Subsaharan African vs Alaskan Athabascan No Vehicles in Household Correlation Chart
The statistical analysis conducted on geographies consisting of 506,014,655 people shows a mild positive correlation between the proportion of Sub-Saharan Africans and percentage of households with no vehicle available in the United States with a correlation coefficient (R) of 0.345 and weighted average of 12.2%. Similarly, the statistical analysis conducted on geographies consisting of 45,793,877 people shows a significant positive correlation between the proportion of Alaskan Athabascans and percentage of households with no vehicle available in the United States with a correlation coefficient (R) of 0.685 and weighted average of 15.6%, a difference of 27.8%.
No Vehicles in Household Correlation Summary
| Measurement | Subsaharan African | Alaskan Athabascan |
| Minimum | 2.7% | 1.0% |
| Maximum | 37.8% | 100.0% |
| Range | 35.0% | 99.0% |
| Mean | 14.2% | 37.7% |
| Median | 12.9% | 28.5% |
| Interquartile 25% (IQ1) | 10.1% | 9.1% |
| Interquartile 75% (IQ3) | 16.0% | 66.7% |
| Interquartile Range (IQR) | 5.9% | 57.6% |
| Standard Deviation (Sample) | 6.6% | 33.1% |
| Standard Deviation (Population) | 6.5% | 32.8% |
Similar Demographics by No Vehicles in Household
Demographics Similar to Sub-Saharan Africans by No Vehicles in Household
In terms of no vehicles in household, the demographic groups most similar to Sub-Saharan Africans are Immigrants from Liberia (12.2%, a difference of 0.070%), Immigrants from Egypt (12.2%, a difference of 0.22%), Macedonian (12.2%, a difference of 0.39%), Immigrants from Switzerland (12.3%, a difference of 0.69%), and African (12.3%, a difference of 0.93%).
| Demographics | Rating | Rank | No Vehicles in Household |
| Immigrants | Uruguay | 1.3 /100 | #254 | Tragic 11.9% |
| Hondurans | 1.2 /100 | #255 | Tragic 12.0% |
| Liberians | 1.2 /100 | #256 | Tragic 12.0% |
| Nigerians | 0.9 /100 | #257 | Tragic 12.1% |
| South American Indians | 0.9 /100 | #258 | Tragic 12.1% |
| Immigrants | Latvia | 0.8 /100 | #259 | Tragic 12.1% |
| Macedonians | 0.7 /100 | #260 | Tragic 12.2% |
| Sub-Saharan Africans | 0.6 /100 | #261 | Tragic 12.2% |
| Immigrants | Liberia | 0.6 /100 | #262 | Tragic 12.2% |
| Immigrants | Egypt | 0.6 /100 | #263 | Tragic 12.2% |
| Immigrants | Switzerland | 0.5 /100 | #264 | Tragic 12.3% |
| Africans | 0.4 /100 | #265 | Tragic 12.3% |
| Israelis | 0.3 /100 | #266 | Tragic 12.4% |
| Immigrants | Europe | 0.3 /100 | #267 | Tragic 12.5% |
| Immigrants | Africa | 0.2 /100 | #268 | Tragic 12.5% |
Demographics Similar to Alaskan Athabascans by No Vehicles in Household
In terms of no vehicles in household, the demographic groups most similar to Alaskan Athabascans are Immigrants from Israel (15.6%, a difference of 0.15%), Tohono O'odham (15.6%, a difference of 0.15%), Cape Verdean (15.6%, a difference of 0.16%), Albanian (15.6%, a difference of 0.31%), and Cypriot (15.7%, a difference of 0.44%).
| Demographics | Rating | Rank | No Vehicles in Household |
| Immigrants | China | 0.0 /100 | #305 | Tragic 15.2% |
| Immigrants | Belize | 0.0 /100 | #306 | Tragic 15.4% |
| Immigrants | Haiti | 0.0 /100 | #307 | Tragic 15.4% |
| U.S. Virgin Islanders | 0.0 /100 | #308 | Tragic 15.4% |
| Puerto Ricans | 0.0 /100 | #309 | Tragic 15.5% |
| Cape Verdeans | 0.0 /100 | #310 | Tragic 15.6% |
| Immigrants | Israel | 0.0 /100 | #311 | Tragic 15.6% |
| Alaskan Athabascans | 0.0 /100 | #312 | Tragic 15.6% |
| Tohono O'odham | 0.0 /100 | #313 | Tragic 15.6% |
| Albanians | 0.0 /100 | #314 | Tragic 15.6% |
| Cypriots | 0.0 /100 | #315 | Tragic 15.7% |
| Ghanaians | 0.0 /100 | #316 | Tragic 16.4% |
| Immigrants | Ghana | 0.0 /100 | #317 | Tragic 16.6% |
| Immigrants | Belarus | 0.0 /100 | #318 | Tragic 16.7% |
| Alaska Natives | 0.0 /100 | #319 | Tragic 17.4% |