Subsaharan African vs Italian No Vehicles in Household
COMPARE
Subsaharan African
Italian
No Vehicles in Household
No Vehicles in Household Comparison
Sub-Saharan Africans
Italians
12.2%
NO VEHICLES IN HOUSEHOLD
0.6/ 100
METRIC RATING
261st/ 347
METRIC RANK
8.6%
NO VEHICLES IN HOUSEHOLD
99.4/ 100
METRIC RATING
83rd/ 347
METRIC RANK
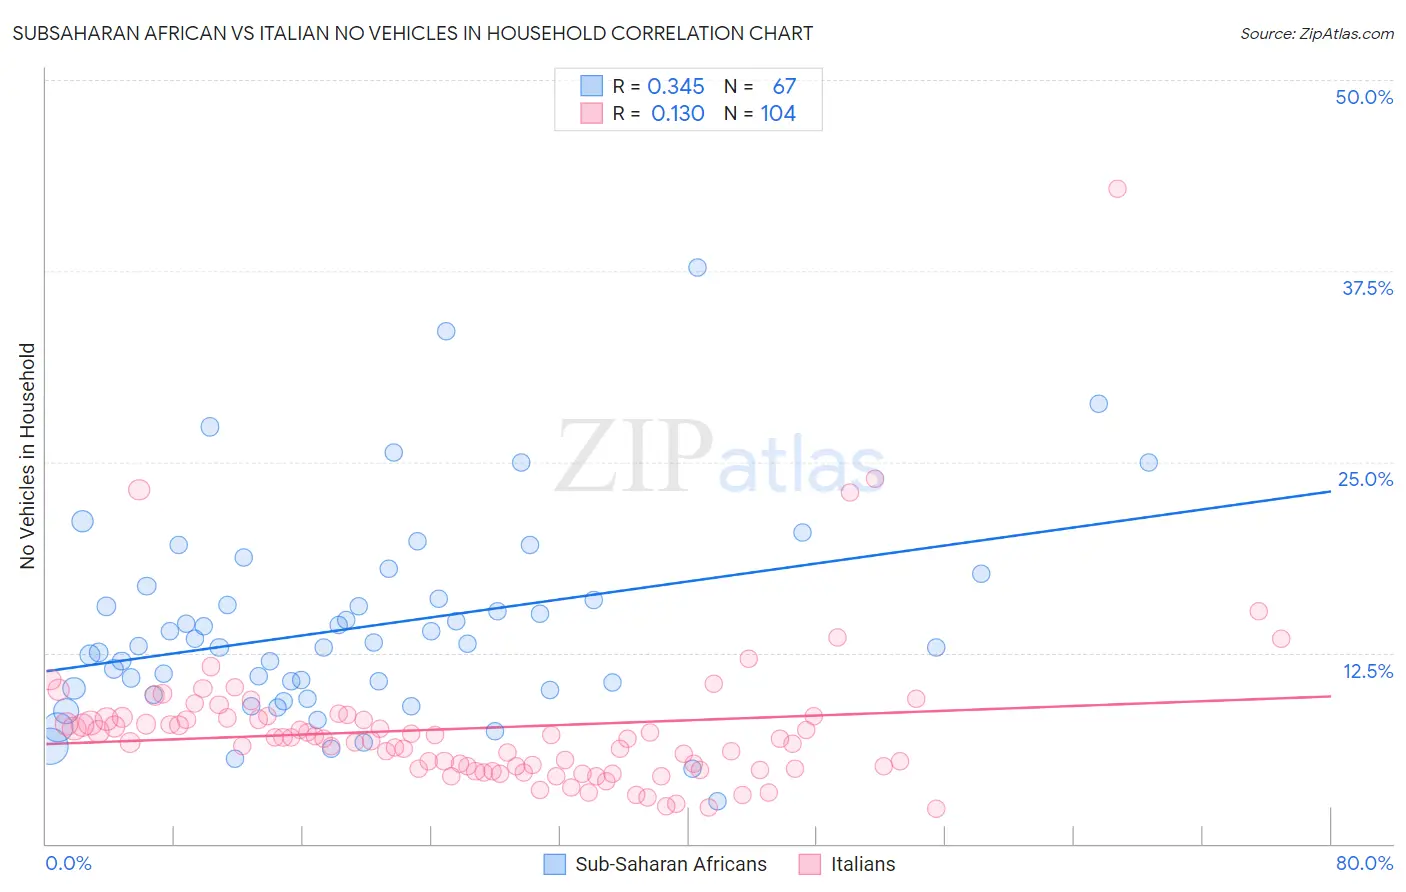
Subsaharan African vs Italian No Vehicles in Household Correlation Chart
The statistical analysis conducted on geographies consisting of 506,014,655 people shows a mild positive correlation between the proportion of Sub-Saharan Africans and percentage of households with no vehicle available in the United States with a correlation coefficient (R) of 0.345 and weighted average of 12.2%. Similarly, the statistical analysis conducted on geographies consisting of 569,049,738 people shows a poor positive correlation between the proportion of Italians and percentage of households with no vehicle available in the United States with a correlation coefficient (R) of 0.130 and weighted average of 8.6%, a difference of 41.5%.
No Vehicles in Household Correlation Summary
| Measurement | Subsaharan African | Italian |
| Minimum | 2.7% | 2.3% |
| Maximum | 37.8% | 42.9% |
| Range | 35.0% | 40.6% |
| Mean | 14.2% | 7.6% |
| Median | 12.9% | 6.9% |
| Interquartile 25% (IQ1) | 10.1% | 4.9% |
| Interquartile 75% (IQ3) | 16.0% | 8.2% |
| Interquartile Range (IQR) | 5.9% | 3.3% |
| Standard Deviation (Sample) | 6.6% | 5.1% |
| Standard Deviation (Population) | 6.5% | 5.1% |
Similar Demographics by No Vehicles in Household
Demographics Similar to Sub-Saharan Africans by No Vehicles in Household
In terms of no vehicles in household, the demographic groups most similar to Sub-Saharan Africans are Immigrants from Liberia (12.2%, a difference of 0.070%), Immigrants from Egypt (12.2%, a difference of 0.22%), Macedonian (12.2%, a difference of 0.39%), Immigrants from Switzerland (12.3%, a difference of 0.69%), and African (12.3%, a difference of 0.93%).
| Demographics | Rating | Rank | No Vehicles in Household |
| Immigrants | Uruguay | 1.3 /100 | #254 | Tragic 11.9% |
| Hondurans | 1.2 /100 | #255 | Tragic 12.0% |
| Liberians | 1.2 /100 | #256 | Tragic 12.0% |
| Nigerians | 0.9 /100 | #257 | Tragic 12.1% |
| South American Indians | 0.9 /100 | #258 | Tragic 12.1% |
| Immigrants | Latvia | 0.8 /100 | #259 | Tragic 12.1% |
| Macedonians | 0.7 /100 | #260 | Tragic 12.2% |
| Sub-Saharan Africans | 0.6 /100 | #261 | Tragic 12.2% |
| Immigrants | Liberia | 0.6 /100 | #262 | Tragic 12.2% |
| Immigrants | Egypt | 0.6 /100 | #263 | Tragic 12.2% |
| Immigrants | Switzerland | 0.5 /100 | #264 | Tragic 12.3% |
| Africans | 0.4 /100 | #265 | Tragic 12.3% |
| Israelis | 0.3 /100 | #266 | Tragic 12.4% |
| Immigrants | Europe | 0.3 /100 | #267 | Tragic 12.5% |
| Immigrants | Africa | 0.2 /100 | #268 | Tragic 12.5% |
Demographics Similar to Italians by No Vehicles in Household
In terms of no vehicles in household, the demographic groups most similar to Italians are Immigrants from Jordan (8.7%, a difference of 0.25%), Lebanese (8.7%, a difference of 0.31%), Immigrants from South Eastern Asia (8.6%, a difference of 0.34%), Bangladeshi (8.7%, a difference of 0.41%), and Tsimshian (8.6%, a difference of 0.47%).
| Demographics | Rating | Rank | No Vehicles in Household |
| Immigrants | Philippines | 99.5 /100 | #76 | Exceptional 8.5% |
| Iranians | 99.5 /100 | #77 | Exceptional 8.6% |
| Immigrants | South Central Asia | 99.5 /100 | #78 | Exceptional 8.6% |
| Portuguese | 99.5 /100 | #79 | Exceptional 8.6% |
| Bolivians | 99.4 /100 | #80 | Exceptional 8.6% |
| Tsimshian | 99.4 /100 | #81 | Exceptional 8.6% |
| Immigrants | South Eastern Asia | 99.4 /100 | #82 | Exceptional 8.6% |
| Italians | 99.4 /100 | #83 | Exceptional 8.6% |
| Immigrants | Jordan | 99.3 /100 | #84 | Exceptional 8.7% |
| Lebanese | 99.3 /100 | #85 | Exceptional 8.7% |
| Bangladeshis | 99.3 /100 | #86 | Exceptional 8.7% |
| Immigrants | England | 99.2 /100 | #87 | Exceptional 8.7% |
| Osage | 99.2 /100 | #88 | Exceptional 8.7% |
| Immigrants | Cuba | 99.2 /100 | #89 | Exceptional 8.7% |
| Bhutanese | 99.2 /100 | #90 | Exceptional 8.7% |