Subsaharan African vs Immigrants from Caribbean No Vehicles in Household
COMPARE
Subsaharan African
Immigrants from Caribbean
No Vehicles in Household
No Vehicles in Household Comparison
Sub-Saharan Africans
Immigrants from Caribbean
12.2%
NO VEHICLES IN HOUSEHOLD
0.6/ 100
METRIC RATING
261st/ 347
METRIC RANK
19.6%
NO VEHICLES IN HOUSEHOLD
0.0/ 100
METRIC RATING
324th/ 347
METRIC RANK
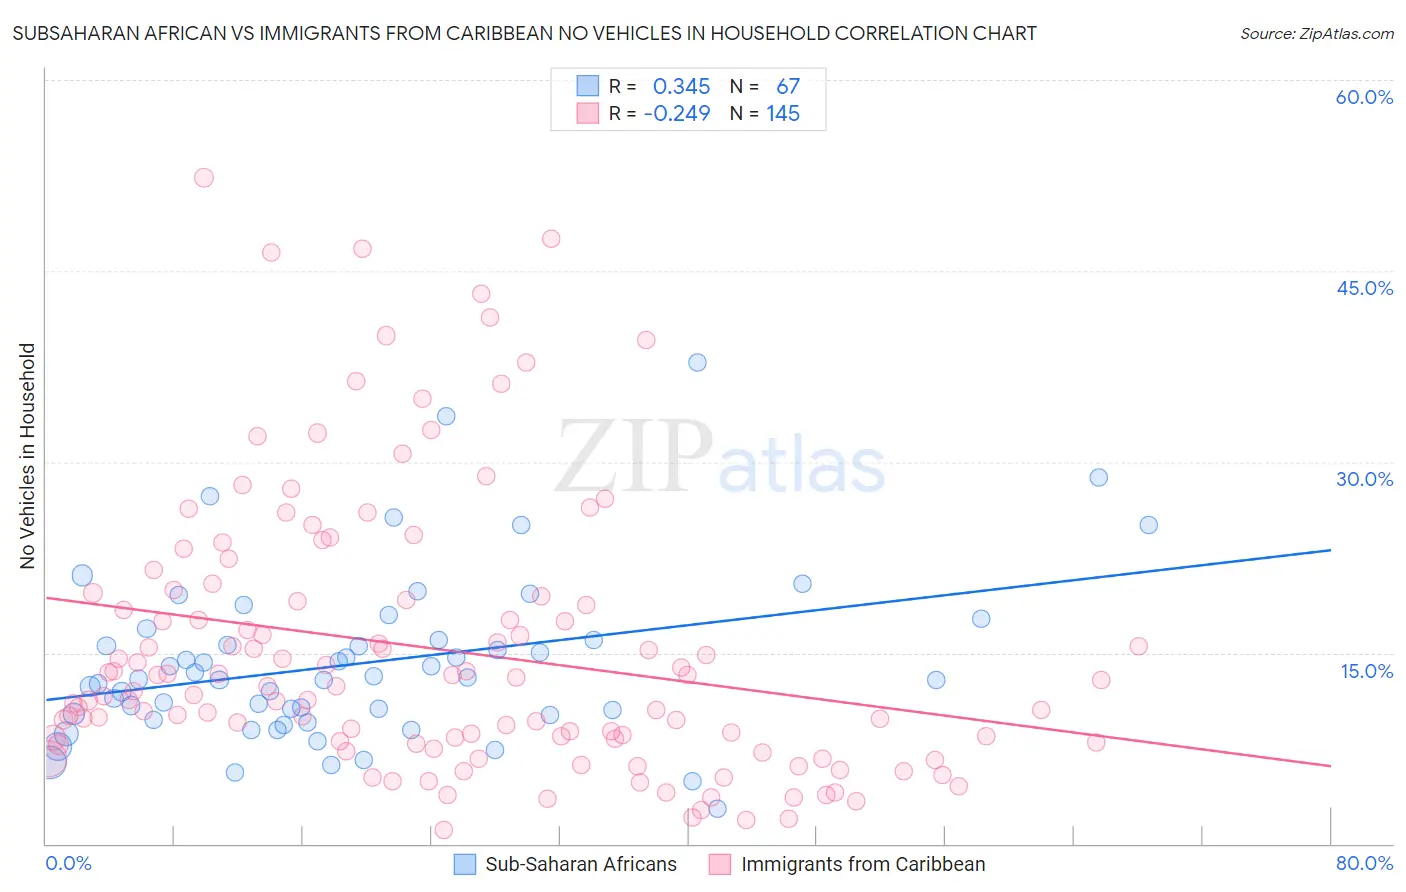
Subsaharan African vs Immigrants from Caribbean No Vehicles in Household Correlation Chart
The statistical analysis conducted on geographies consisting of 506,014,655 people shows a mild positive correlation between the proportion of Sub-Saharan Africans and percentage of households with no vehicle available in the United States with a correlation coefficient (R) of 0.345 and weighted average of 12.2%. Similarly, the statistical analysis conducted on geographies consisting of 448,573,126 people shows a weak negative correlation between the proportion of Immigrants from Caribbean and percentage of households with no vehicle available in the United States with a correlation coefficient (R) of -0.249 and weighted average of 19.6%, a difference of 60.7%.
No Vehicles in Household Correlation Summary
| Measurement | Subsaharan African | Immigrants from Caribbean |
| Minimum | 2.7% | 1.0% |
| Maximum | 37.8% | 52.3% |
| Range | 35.0% | 51.3% |
| Mean | 14.2% | 15.3% |
| Median | 12.9% | 12.4% |
| Interquartile 25% (IQ1) | 10.1% | 8.0% |
| Interquartile 75% (IQ3) | 16.0% | 19.3% |
| Interquartile Range (IQR) | 5.9% | 11.3% |
| Standard Deviation (Sample) | 6.6% | 10.8% |
| Standard Deviation (Population) | 6.5% | 10.8% |
Similar Demographics by No Vehicles in Household
Demographics Similar to Sub-Saharan Africans by No Vehicles in Household
In terms of no vehicles in household, the demographic groups most similar to Sub-Saharan Africans are Immigrants from Liberia (12.2%, a difference of 0.070%), Immigrants from Egypt (12.2%, a difference of 0.22%), Macedonian (12.2%, a difference of 0.39%), Immigrants from Switzerland (12.3%, a difference of 0.69%), and African (12.3%, a difference of 0.93%).
| Demographics | Rating | Rank | No Vehicles in Household |
| Immigrants | Uruguay | 1.3 /100 | #254 | Tragic 11.9% |
| Hondurans | 1.2 /100 | #255 | Tragic 12.0% |
| Liberians | 1.2 /100 | #256 | Tragic 12.0% |
| Nigerians | 0.9 /100 | #257 | Tragic 12.1% |
| South American Indians | 0.9 /100 | #258 | Tragic 12.1% |
| Immigrants | Latvia | 0.8 /100 | #259 | Tragic 12.1% |
| Macedonians | 0.7 /100 | #260 | Tragic 12.2% |
| Sub-Saharan Africans | 0.6 /100 | #261 | Tragic 12.2% |
| Immigrants | Liberia | 0.6 /100 | #262 | Tragic 12.2% |
| Immigrants | Egypt | 0.6 /100 | #263 | Tragic 12.2% |
| Immigrants | Switzerland | 0.5 /100 | #264 | Tragic 12.3% |
| Africans | 0.4 /100 | #265 | Tragic 12.3% |
| Israelis | 0.3 /100 | #266 | Tragic 12.4% |
| Immigrants | Europe | 0.3 /100 | #267 | Tragic 12.5% |
| Immigrants | Africa | 0.2 /100 | #268 | Tragic 12.5% |
Demographics Similar to Immigrants from Caribbean by No Vehicles in Household
In terms of no vehicles in household, the demographic groups most similar to Immigrants from Caribbean are Senegalese (19.8%, a difference of 0.72%), Immigrants from Yemen (19.5%, a difference of 0.73%), Immigrants from West Indies (20.5%, a difference of 4.7%), Immigrants from Cabo Verde (18.4%, a difference of 6.3%), and Immigrants from Senegal (21.1%, a difference of 7.8%).
| Demographics | Rating | Rank | No Vehicles in Household |
| Immigrants | Ghana | 0.0 /100 | #317 | Tragic 16.6% |
| Immigrants | Belarus | 0.0 /100 | #318 | Tragic 16.7% |
| Alaska Natives | 0.0 /100 | #319 | Tragic 17.4% |
| Soviet Union | 0.0 /100 | #320 | Tragic 17.4% |
| Jamaicans | 0.0 /100 | #321 | Tragic 17.9% |
| Immigrants | Cabo Verde | 0.0 /100 | #322 | Tragic 18.4% |
| Immigrants | Yemen | 0.0 /100 | #323 | Tragic 19.5% |
| Immigrants | Caribbean | 0.0 /100 | #324 | Tragic 19.6% |
| Senegalese | 0.0 /100 | #325 | Tragic 19.8% |
| Immigrants | West Indies | 0.0 /100 | #326 | Tragic 20.5% |
| Immigrants | Senegal | 0.0 /100 | #327 | Tragic 21.1% |
| Immigrants | Dominica | 0.0 /100 | #328 | Tragic 22.2% |
| Ecuadorians | 0.0 /100 | #329 | Tragic 22.8% |
| West Indians | 0.0 /100 | #330 | Tragic 23.7% |
| Trinidadians and Tobagonians | 0.0 /100 | #331 | Tragic 23.7% |