Subsaharan African vs Alaskan Athabascan Average Family Size

COMPARE

Subsaharan African
Race
Ancestry
AfghanAfricanAlaska NativeAlbanianAleutAlsatianAmericanApacheArabArapahoArgentineanArmenianAssyrian/Chaldean/SyriacAustralianAustrianBahamianBangladeshiBarbadianBasqueBelgianBelizeanBermudanBhutaneseBlackfeetBolivianBrazilianBritishBritish West IndianBulgarianBurmeseCajunCambodianCanadianCape VerdeanCarpatho RusynCelticCentral AmericanCentral American IndianCherokeeCheyenneChickasawChileanChineseChippewaChoctawColombianColvilleComancheCosta RicanCreeCreekCroatianCrowCubanCypriotCzechCzechoslovakianDanishDelawareDominicanDutchDutch West IndianEastern EuropeanEcuadorianEgyptianEnglishEstonianEthiopianEuropeanFijianFilipinoFinnishFrenchFrench American IndianFrench CanadianGermanGerman RussianGhanaianGreekGuamanian/ChamorroGuatemalanGuyaneseHaitianHmongHonduranHopiHoumaHungarianIcelanderIndian (Asian)IndonesianInupiatIranianIraqiIrishIroquoisIsraeliItalianJamaicanJapaneseJordanianKenyanKiowaKoreanLaotianLatvianLebaneseLiberianLithuanianLumbeeLuxembourgerMacedonianMalaysianMalteseMarshalleseMenomineeMexicanMexican American IndianMongolianMoroccanNative HawaiianNavajoNepaleseNew ZealanderNicaraguanNigerianNorthern EuropeanNorwegianOkinawanOsageOttawaPaiutePakistaniPalestinianPanamanianParaguayanPennsylvania GermanPeruvianPimaPolishPortuguesePotawatomiPuebloPuerto RicanPuget Sound SalishRomanianRussianSalvadoranSamoanScandinavianScotch-IrishScottishSeminoleSenegaleseSerbianShoshoneSierra LeoneanSiouxSlavicSlovakSloveneSomaliSouth AfricanSouth AmericanSouth American IndianSoviet UnionSpaniardSpanishSpanish AmericanSpanish American IndianSri LankanSubsaharan AfricanSudaneseSwedishSwissSyrianTaiwaneseThaiTlingit-HaidaTohono O'OdhamTonganTrinidadian and TobagonianTsimshianTurkishU.S. Virgin IslanderUgandanUkrainianUruguayanUteVenezuelanVietnameseWelshWest IndianYakamaYaquiYugoslavianYumanYup'ikZimbabwean
Immigration
NonimmigrantsImmigrantsAfghanistanAfricaAlbaniaArgentinaArmeniaAsiaAustraliaAustriaBahamasBangladeshBarbadosBelarusBelgiumBelizeBoliviaBosnia and HerzegovinaBrazilBulgariaBurma/MyanmarCabo VerdeCambodiaCameroonCanadaCaribbeanCentral AmericaChileChinaColombiaCongoCosta RicaCroatiaCubaCzechoslovakiaDenmarkDominicaDominican RepublicEastern AfricaEastern AsiaEastern EuropeEcuadorEgyptEl SalvadorEnglandEritreaEthiopiaEuropeFijiFranceGermanyGhanaGreeceGrenadaGuatemalaGuyanaHaitiHondurasHong KongHungaryIndiaIndonesiaIranIraqIrelandIsraelItalyJamaicaJapanJordanKazakhstanKenyaKoreaKuwaitLaosLatin AmericaLatviaLebanonLiberiaLithuaniaMalaysiaMexicoMicronesiaMiddle AfricaMoldovaMoroccoNepalNetherlandsNicaraguaNigeriaNorth AmericaNorth MacedoniaNorthern AfricaNorthern EuropeNorwayOceaniaPakistanPanamaPeruPhilippinesPolandPortugalRomaniaRussiaSaudi ArabiaScotlandSenegalSerbiaSierra LeoneSingaporeSomaliaSouth AfricaSouth AmericaSouth Central AsiaSouth Eastern AsiaSouthern EuropeSpainSri LankaSt. Vincent and the GrenadinesSudanSwedenSwitzerlandSyriaTaiwanThailandTrinidad and TobagoTurkeyUgandaUkraineUruguayUzbekistanVenezuelaVietnamWest IndiesWestern AfricaWestern AsiaWestern EuropeYemenZaireZimbabweAzores
Alaskan Athabascan
Race
Ancestry
AfghanAfricanAlaska NativeAlaskan AthabascanAlbanianAleutAlsatianAmericanApacheArabArapahoArgentineanArmenianAssyrian/Chaldean/SyriacAustralianAustrianBahamianBangladeshiBarbadianBasqueBelgianBelizeanBermudanBhutaneseBlackfeetBolivianBrazilianBritishBritish West IndianBulgarianBurmeseCajunCambodianCanadianCape VerdeanCarpatho RusynCelticCentral AmericanCentral American IndianCherokeeCheyenneChickasawChileanChineseChippewaChoctawColombianColvilleComancheCosta RicanCreeCreekCroatianCrowCubanCypriotCzechCzechoslovakianDanishDelawareDominicanDutchDutch West IndianEastern EuropeanEcuadorianEgyptianEnglishEstonianEthiopianEuropeanFijianFilipinoFinnishFrenchFrench American IndianFrench CanadianGermanGerman RussianGhanaianGreekGuamanian/ChamorroGuatemalanGuyaneseHaitianHmongHonduranHopiHoumaHungarianIcelanderIndian (Asian)IndonesianInupiatIranianIraqiIrishIroquoisIsraeliItalianJamaicanJapaneseJordanianKenyanKiowaKoreanLaotianLatvianLebaneseLiberianLithuanianLumbeeLuxembourgerMacedonianMalaysianMalteseMarshalleseMenomineeMexicanMexican American IndianMongolianMoroccanNative HawaiianNavajoNepaleseNew ZealanderNicaraguanNigerianNorthern EuropeanNorwegianOkinawanOsageOttawaPaiutePakistaniPalestinianPanamanianParaguayanPennsylvania GermanPeruvianPimaPolishPortuguesePotawatomiPuebloPuerto RicanPuget Sound SalishRomanianRussianSalvadoranSamoanScandinavianScotch-IrishScottishSeminoleSenegaleseSerbianShoshoneSierra LeoneanSiouxSlavicSlovakSloveneSomaliSouth AfricanSouth AmericanSouth American IndianSoviet UnionSpaniardSpanishSpanish AmericanSpanish American IndianSri LankanSudaneseSwedishSwissSyrianTaiwaneseThaiTlingit-HaidaTohono O'OdhamTonganTrinidadian and TobagonianTsimshianTurkishU.S. Virgin IslanderUgandanUkrainianUruguayanUteVenezuelanVietnameseWelshWest IndianYakamaYaquiYugoslavianYumanYup'ikZimbabwean
Immigration
NonimmigrantsImmigrantsAfghanistanAfricaAlbaniaArgentinaArmeniaAsiaAustraliaAustriaBahamasBangladeshBarbadosBelarusBelgiumBelizeBoliviaBosnia and HerzegovinaBrazilBulgariaBurma/MyanmarCabo VerdeCambodiaCameroonCanadaCaribbeanCentral AmericaChileChinaColombiaCongoCosta RicaCroatiaCubaCzechoslovakiaDenmarkDominicaDominican RepublicEastern AfricaEastern AsiaEastern EuropeEcuadorEgyptEl SalvadorEnglandEritreaEthiopiaEuropeFijiFranceGermanyGhanaGreeceGrenadaGuatemalaGuyanaHaitiHondurasHong KongHungaryIndiaIndonesiaIranIraqIrelandIsraelItalyJamaicaJapanJordanKazakhstanKenyaKoreaKuwaitLaosLatin AmericaLatviaLebanonLiberiaLithuaniaMalaysiaMexicoMicronesiaMiddle AfricaMoldovaMoroccoNepalNetherlandsNicaraguaNigeriaNorth AmericaNorth MacedoniaNorthern AfricaNorthern EuropeNorwayOceaniaPakistanPanamaPeruPhilippinesPolandPortugalRomaniaRussiaSaudi ArabiaScotlandSenegalSerbiaSierra LeoneSingaporeSomaliaSouth AfricaSouth AmericaSouth Central AsiaSouth Eastern AsiaSouthern EuropeSpainSri LankaSt. Vincent and the GrenadinesSudanSwedenSwitzerlandSyriaTaiwanThailandTrinidad and TobagoTurkeyUgandaUkraineUruguayUzbekistanVenezuelaVietnamWest IndiesWestern AfricaWestern AsiaWestern EuropeYemenZaireZimbabweAzores
Average Family Size
Income
Poverty
Unemployment
Labor Participation
Family Structure
Vehicle Availability
Education Level
Disability

Average Family Size Comparison

Sub-Saharan Africans

Alaskan Athabascans

Excellent
Exceptional
3.25
AVERAGE FAMILY SIZE
81.6/ 100
METRIC RATING
140th/ 347
METRIC RANK
3.27
AVERAGE FAMILY SIZE
92.4/ 100
METRIC RATING
123rd/ 347
METRIC RANK

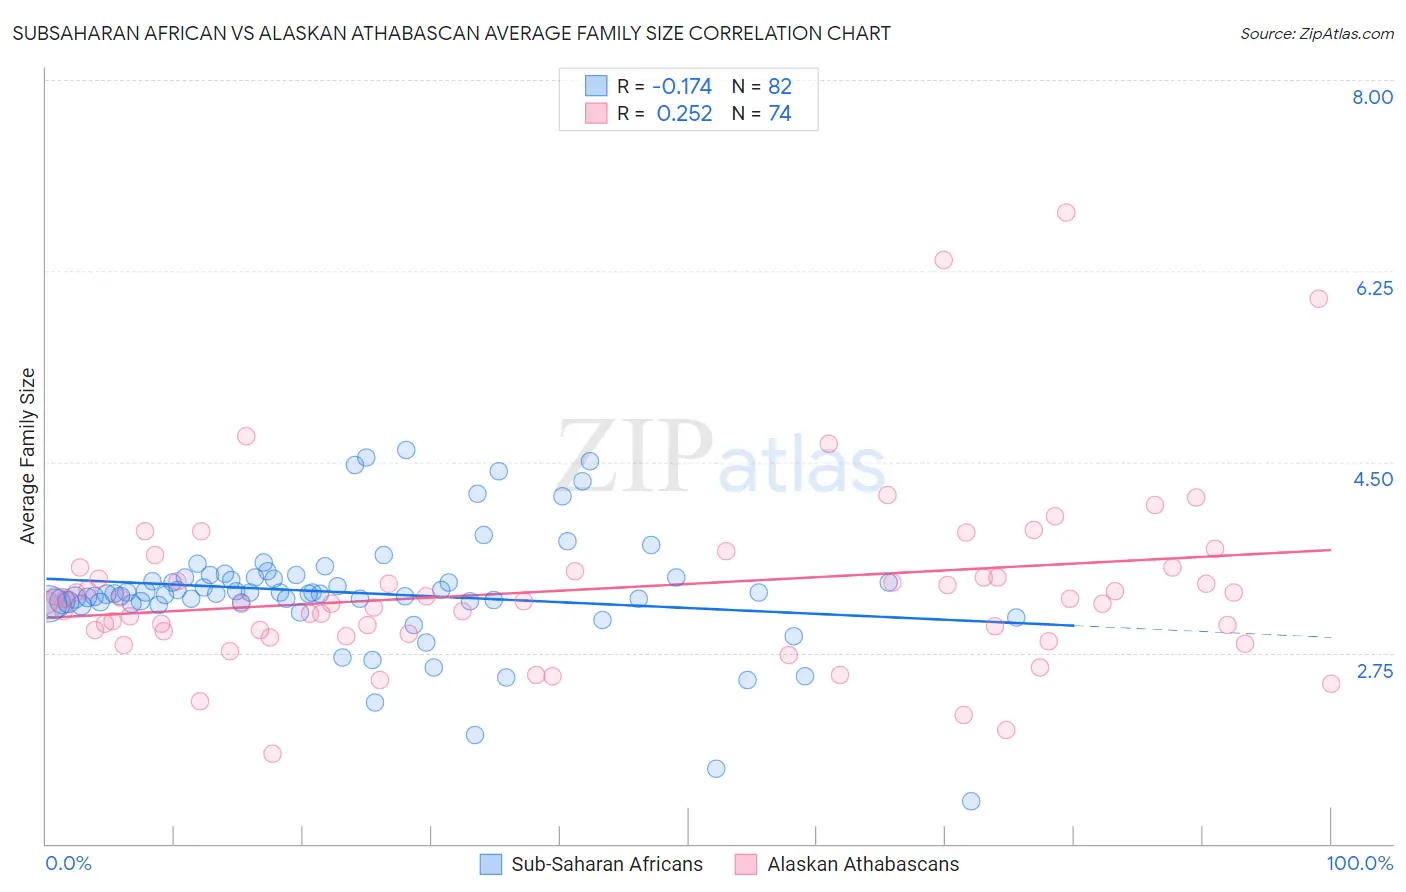
Subsaharan African vs Alaskan Athabascan Average Family Size Correlation Chart

The statistical analysis conducted on geographies consisting of 507,604,346 people shows a poor negative correlation between the proportion of Sub-Saharan Africans and average family size in the United States with a correlation coefficient (R) of -0.174 and weighted average of 3.25. Similarly, the statistical analysis conducted on geographies consisting of 45,814,644 people shows a weak positive correlation between the proportion of Alaskan Athabascans and average family size in the United States with a correlation coefficient (R) of 0.252 and weighted average of 3.27, a difference of 0.46%.
Subsaharan African vs Alaskan Athabascan Average Family Size

Average Family Size Correlation Summary

MeasurementSubsaharan AfricanAlaskan Athabascan
Minimum1.391.83
Maximum4.616.79
Range3.224.96
Mean3.303.34
Median3.293.21
Interquartile 25% (IQ1)3.212.95
Interquartile 75% (IQ3)3.443.50
Interquartile Range (IQR)0.230.55
Standard Deviation (Sample)0.540.82
Standard Deviation (Population)0.540.82

Demographics Similar to Sub-Saharan Africans and Alaskan Athabascans by Average Family Size

In terms of average family size, the demographic groups most similar to Sub-Saharan Africans are Immigrants from Ethiopia (3.25, a difference of 0.0%), Venezuelan (3.25, a difference of 0.0%), Cuban (3.25, a difference of 0.010%), Immigrants from Middle Africa (3.25, a difference of 0.020%), and Comanche (3.25, a difference of 0.040%). Similarly, the demographic groups most similar to Alaskan Athabascans are Immigrants from Colombia (3.27, a difference of 0.020%), South American Indian (3.26, a difference of 0.050%), Immigrants from Thailand (3.27, a difference of 0.060%), Immigrants from Cuba (3.26, a difference of 0.070%), and Immigrants from Costa Rica (3.26, a difference of 0.10%).
DemographicsRating | RankAverage Family Size
Immigrants | Thailand
93.3
/100
|
#121
Exceptional
3.27
Immigrants | Colombia
92.8
/100
|
#122
Exceptional
3.27
Alaskan Athabascans
92.4
/100
|
#123
Exceptional
3.27
South American Indians
91.6
/100
|
#124
Exceptional
3.26
Immigrants | Cuba
91.3
/100
|
#125
Exceptional
3.26
Immigrants | Costa Rica
90.7
/100
|
#126
Exceptional
3.26
Immigrants | Syria
90.6
/100
|
#127
Exceptional
3.26
Colombians
89.9
/100
|
#128
Excellent
3.26
Immigrants | Hong Kong
88.6
/100
|
#129
Excellent
3.26
Laotians
88.5
/100
|
#130
Excellent
3.26
Immigrants | Western Asia
87.7
/100
|
#131
Excellent
3.26
Costa Ricans
86.8
/100
|
#132
Excellent
3.26
Immigrants | Venezuela
86.3
/100
|
#133
Excellent
3.26
Africans
84.9
/100
|
#134
Excellent
3.25
Panamanians
84.2
/100
|
#135
Excellent
3.25
Comanche
82.8
/100
|
#136
Excellent
3.25
Immigrants | Middle Africa
82.4
/100
|
#137
Excellent
3.25
Cubans
81.8
/100
|
#138
Excellent
3.25
Immigrants | Ethiopia
81.6
/100
|
#139
Excellent
3.25
Sub-Saharan Africans
81.6
/100
|
#140
Excellent
3.25
Venezuelans
81.4
/100
|
#141
Excellent
3.25