Immigrants from Somalia vs Alaskan Athabascan No Vehicles in Household
COMPARE
Immigrants from Somalia
Alaskan Athabascan
No Vehicles in Household
No Vehicles in Household Comparison
Immigrants from Somalia
Alaskan Athabascans
11.4%
NO VEHICLES IN HOUSEHOLD
5.4/ 100
METRIC RATING
226th/ 347
METRIC RANK
15.6%
NO VEHICLES IN HOUSEHOLD
0.0/ 100
METRIC RATING
312th/ 347
METRIC RANK
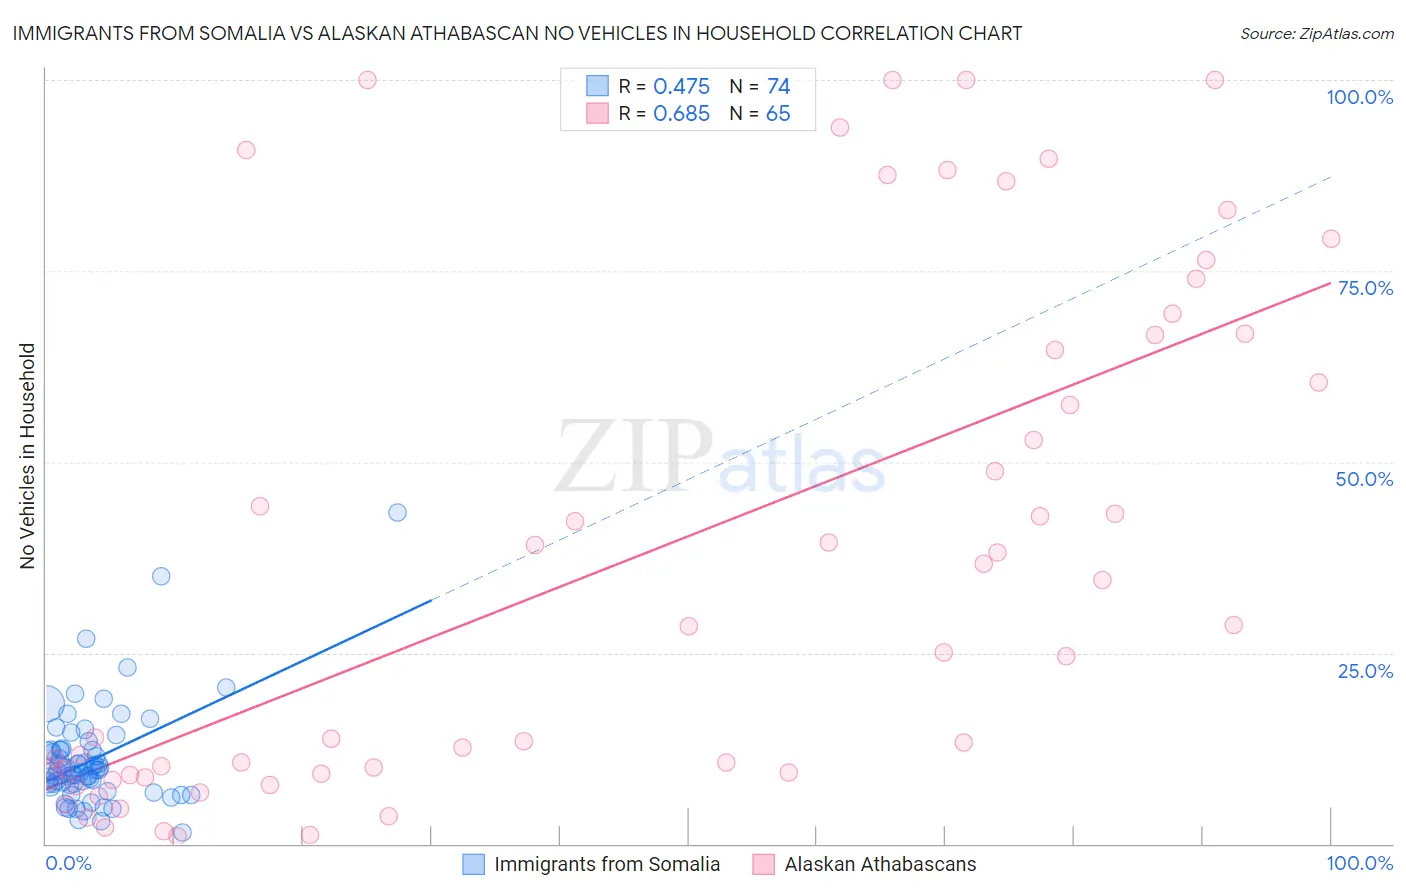
Immigrants from Somalia vs Alaskan Athabascan No Vehicles in Household Correlation Chart
The statistical analysis conducted on geographies consisting of 92,070,228 people shows a moderate positive correlation between the proportion of Immigrants from Somalia and percentage of households with no vehicle available in the United States with a correlation coefficient (R) of 0.475 and weighted average of 11.4%. Similarly, the statistical analysis conducted on geographies consisting of 45,793,877 people shows a significant positive correlation between the proportion of Alaskan Athabascans and percentage of households with no vehicle available in the United States with a correlation coefficient (R) of 0.685 and weighted average of 15.6%, a difference of 36.7%.
No Vehicles in Household Correlation Summary
| Measurement | Immigrants from Somalia | Alaskan Athabascan |
| Minimum | 1.4% | 1.0% |
| Maximum | 43.3% | 100.0% |
| Range | 41.9% | 99.0% |
| Mean | 11.0% | 37.7% |
| Median | 9.5% | 28.5% |
| Interquartile 25% (IQ1) | 7.7% | 9.1% |
| Interquartile 75% (IQ3) | 12.3% | 66.7% |
| Interquartile Range (IQR) | 4.6% | 57.6% |
| Standard Deviation (Sample) | 6.7% | 33.1% |
| Standard Deviation (Population) | 6.6% | 32.8% |
Similar Demographics by No Vehicles in Household
Demographics Similar to Immigrants from Somalia by No Vehicles in Household
In terms of no vehicles in household, the demographic groups most similar to Immigrants from Somalia are Immigrants from Pakistan (11.4%, a difference of 0.020%), Immigrants from Romania (11.4%, a difference of 0.060%), Ugandan (11.4%, a difference of 0.10%), Immigrants from Norway (11.4%, a difference of 0.23%), and Immigrants from Japan (11.4%, a difference of 0.23%).
| Demographics | Rating | Rank | No Vehicles in Household |
| Argentineans | 9.6 /100 | #219 | Tragic 11.2% |
| Immigrants | Zaire | 9.6 /100 | #220 | Tragic 11.2% |
| Peruvians | 8.4 /100 | #221 | Tragic 11.2% |
| Immigrants | South America | 8.0 /100 | #222 | Tragic 11.3% |
| Uruguayans | 7.7 /100 | #223 | Tragic 11.3% |
| Immigrants | Hong Kong | 7.2 /100 | #224 | Tragic 11.3% |
| Immigrants | Sierra Leone | 6.4 /100 | #225 | Tragic 11.3% |
| Immigrants | Somalia | 5.4 /100 | #226 | Tragic 11.4% |
| Immigrants | Pakistan | 5.4 /100 | #227 | Tragic 11.4% |
| Immigrants | Romania | 5.3 /100 | #228 | Tragic 11.4% |
| Ugandans | 5.3 /100 | #229 | Tragic 11.4% |
| Immigrants | Norway | 5.1 /100 | #230 | Tragic 11.4% |
| Immigrants | Japan | 5.1 /100 | #231 | Tragic 11.4% |
| Immigrants | Turkey | 4.8 /100 | #232 | Tragic 11.5% |
| Houma | 4.7 /100 | #233 | Tragic 11.5% |
Demographics Similar to Alaskan Athabascans by No Vehicles in Household
In terms of no vehicles in household, the demographic groups most similar to Alaskan Athabascans are Immigrants from Israel (15.6%, a difference of 0.15%), Tohono O'odham (15.6%, a difference of 0.15%), Cape Verdean (15.6%, a difference of 0.16%), Albanian (15.6%, a difference of 0.31%), and Cypriot (15.7%, a difference of 0.44%).
| Demographics | Rating | Rank | No Vehicles in Household |
| Immigrants | China | 0.0 /100 | #305 | Tragic 15.2% |
| Immigrants | Belize | 0.0 /100 | #306 | Tragic 15.4% |
| Immigrants | Haiti | 0.0 /100 | #307 | Tragic 15.4% |
| U.S. Virgin Islanders | 0.0 /100 | #308 | Tragic 15.4% |
| Puerto Ricans | 0.0 /100 | #309 | Tragic 15.5% |
| Cape Verdeans | 0.0 /100 | #310 | Tragic 15.6% |
| Immigrants | Israel | 0.0 /100 | #311 | Tragic 15.6% |
| Alaskan Athabascans | 0.0 /100 | #312 | Tragic 15.6% |
| Tohono O'odham | 0.0 /100 | #313 | Tragic 15.6% |
| Albanians | 0.0 /100 | #314 | Tragic 15.6% |
| Cypriots | 0.0 /100 | #315 | Tragic 15.7% |
| Ghanaians | 0.0 /100 | #316 | Tragic 16.4% |
| Immigrants | Ghana | 0.0 /100 | #317 | Tragic 16.6% |
| Immigrants | Belarus | 0.0 /100 | #318 | Tragic 16.7% |
| Alaska Natives | 0.0 /100 | #319 | Tragic 17.4% |