Subsaharan African vs Celtic No Vehicles in Household
COMPARE
Subsaharan African
Celtic
No Vehicles in Household
No Vehicles in Household Comparison
Sub-Saharan Africans
Celtics
12.2%
NO VEHICLES IN HOUSEHOLD
0.6/ 100
METRIC RATING
261st/ 347
METRIC RANK
8.1%
NO VEHICLES IN HOUSEHOLD
99.9/ 100
METRIC RATING
55th/ 347
METRIC RANK
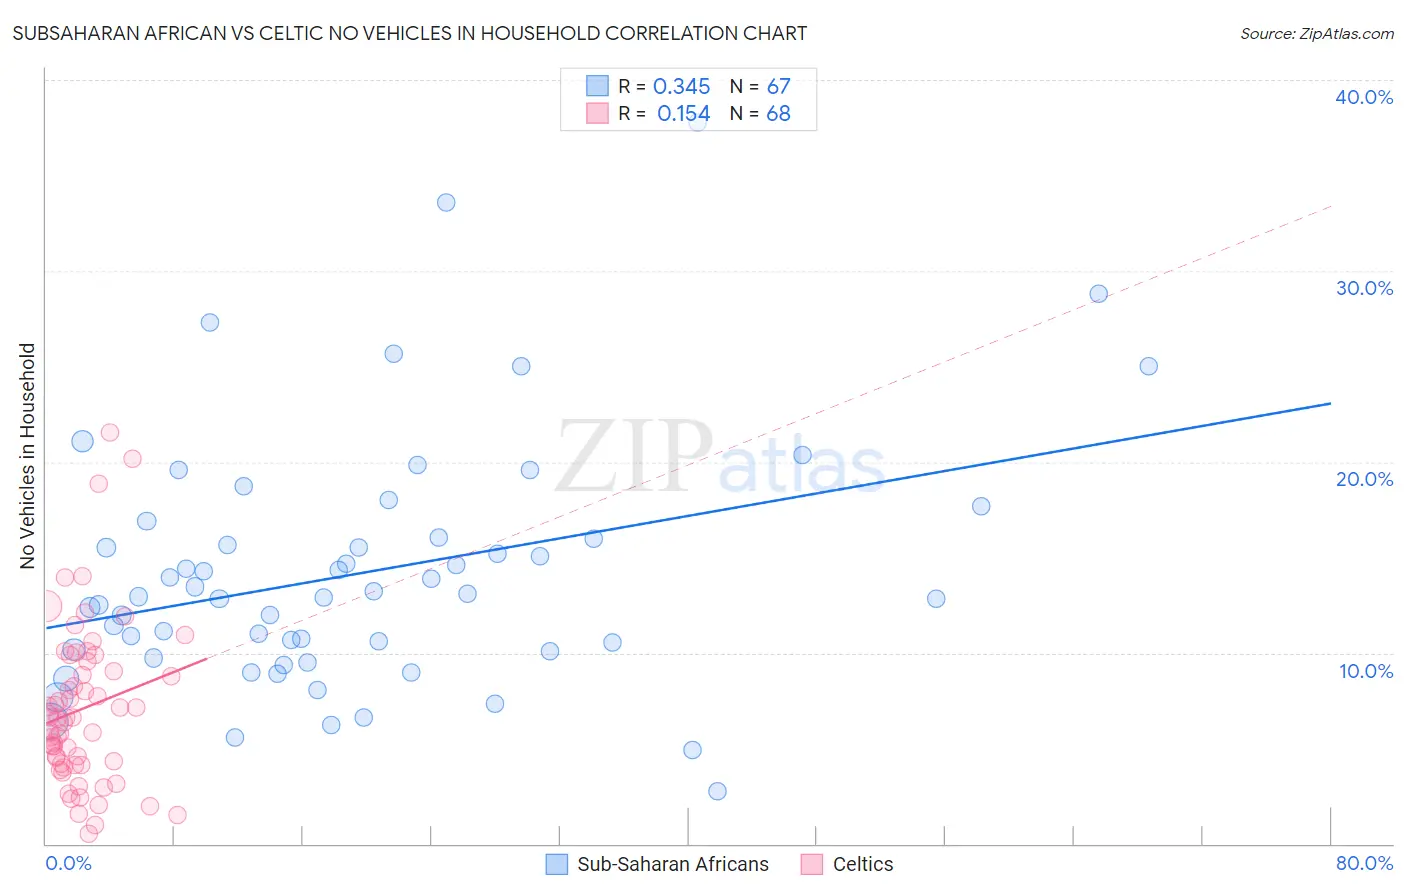
Subsaharan African vs Celtic No Vehicles in Household Correlation Chart
The statistical analysis conducted on geographies consisting of 506,014,655 people shows a mild positive correlation between the proportion of Sub-Saharan Africans and percentage of households with no vehicle available in the United States with a correlation coefficient (R) of 0.345 and weighted average of 12.2%. Similarly, the statistical analysis conducted on geographies consisting of 168,703,210 people shows a poor positive correlation between the proportion of Celtics and percentage of households with no vehicle available in the United States with a correlation coefficient (R) of 0.154 and weighted average of 8.1%, a difference of 51.2%.
No Vehicles in Household Correlation Summary
| Measurement | Subsaharan African | Celtic |
| Minimum | 2.7% | 0.51% |
| Maximum | 37.8% | 21.5% |
| Range | 35.0% | 21.0% |
| Mean | 14.2% | 7.1% |
| Median | 12.9% | 6.6% |
| Interquartile 25% (IQ1) | 10.1% | 4.1% |
| Interquartile 75% (IQ3) | 16.0% | 9.3% |
| Interquartile Range (IQR) | 5.9% | 5.1% |
| Standard Deviation (Sample) | 6.6% | 4.3% |
| Standard Deviation (Population) | 6.5% | 4.2% |
Similar Demographics by No Vehicles in Household
Demographics Similar to Sub-Saharan Africans by No Vehicles in Household
In terms of no vehicles in household, the demographic groups most similar to Sub-Saharan Africans are Immigrants from Liberia (12.2%, a difference of 0.070%), Immigrants from Egypt (12.2%, a difference of 0.22%), Macedonian (12.2%, a difference of 0.39%), Immigrants from Switzerland (12.3%, a difference of 0.69%), and African (12.3%, a difference of 0.93%).
| Demographics | Rating | Rank | No Vehicles in Household |
| Immigrants | Uruguay | 1.3 /100 | #254 | Tragic 11.9% |
| Hondurans | 1.2 /100 | #255 | Tragic 12.0% |
| Liberians | 1.2 /100 | #256 | Tragic 12.0% |
| Nigerians | 0.9 /100 | #257 | Tragic 12.1% |
| South American Indians | 0.9 /100 | #258 | Tragic 12.1% |
| Immigrants | Latvia | 0.8 /100 | #259 | Tragic 12.1% |
| Macedonians | 0.7 /100 | #260 | Tragic 12.2% |
| Sub-Saharan Africans | 0.6 /100 | #261 | Tragic 12.2% |
| Immigrants | Liberia | 0.6 /100 | #262 | Tragic 12.2% |
| Immigrants | Egypt | 0.6 /100 | #263 | Tragic 12.2% |
| Immigrants | Switzerland | 0.5 /100 | #264 | Tragic 12.3% |
| Africans | 0.4 /100 | #265 | Tragic 12.3% |
| Israelis | 0.3 /100 | #266 | Tragic 12.4% |
| Immigrants | Europe | 0.3 /100 | #267 | Tragic 12.5% |
| Immigrants | Africa | 0.2 /100 | #268 | Tragic 12.5% |
Demographics Similar to Celtics by No Vehicles in Household
In terms of no vehicles in household, the demographic groups most similar to Celtics are Immigrants from Venezuela (8.1%, a difference of 0.090%), Immigrants from Afghanistan (8.1%, a difference of 0.39%), Hawaiian (8.0%, a difference of 0.40%), Slovene (8.0%, a difference of 0.40%), and Venezuelan (8.1%, a difference of 0.68%).
| Demographics | Rating | Rank | No Vehicles in Household |
| Afghans | 99.9 /100 | #48 | Exceptional 8.0% |
| Guamanians/Chamorros | 99.9 /100 | #49 | Exceptional 8.0% |
| Belgians | 99.9 /100 | #50 | Exceptional 8.0% |
| Koreans | 99.9 /100 | #51 | Exceptional 8.0% |
| Hawaiians | 99.9 /100 | #52 | Exceptional 8.0% |
| Slovenes | 99.9 /100 | #53 | Exceptional 8.0% |
| Immigrants | Venezuela | 99.9 /100 | #54 | Exceptional 8.1% |
| Celtics | 99.9 /100 | #55 | Exceptional 8.1% |
| Immigrants | Afghanistan | 99.9 /100 | #56 | Exceptional 8.1% |
| Venezuelans | 99.8 /100 | #57 | Exceptional 8.1% |
| Immigrants | Mexico | 99.8 /100 | #58 | Exceptional 8.1% |
| Immigrants | India | 99.8 /100 | #59 | Exceptional 8.2% |
| Immigrants | Laos | 99.8 /100 | #60 | Exceptional 8.2% |
| Thais | 99.8 /100 | #61 | Exceptional 8.2% |
| Chinese | 99.8 /100 | #62 | Exceptional 8.2% |