Filipino vs Alaskan Athabascan No Vehicles in Household
COMPARE
Filipino
Alaskan Athabascan
No Vehicles in Household
No Vehicles in Household Comparison
Filipinos
Alaskan Athabascans
10.4%
NO VEHICLES IN HOUSEHOLD
50.1/ 100
METRIC RATING
173rd/ 347
METRIC RANK
15.6%
NO VEHICLES IN HOUSEHOLD
0.0/ 100
METRIC RATING
312th/ 347
METRIC RANK
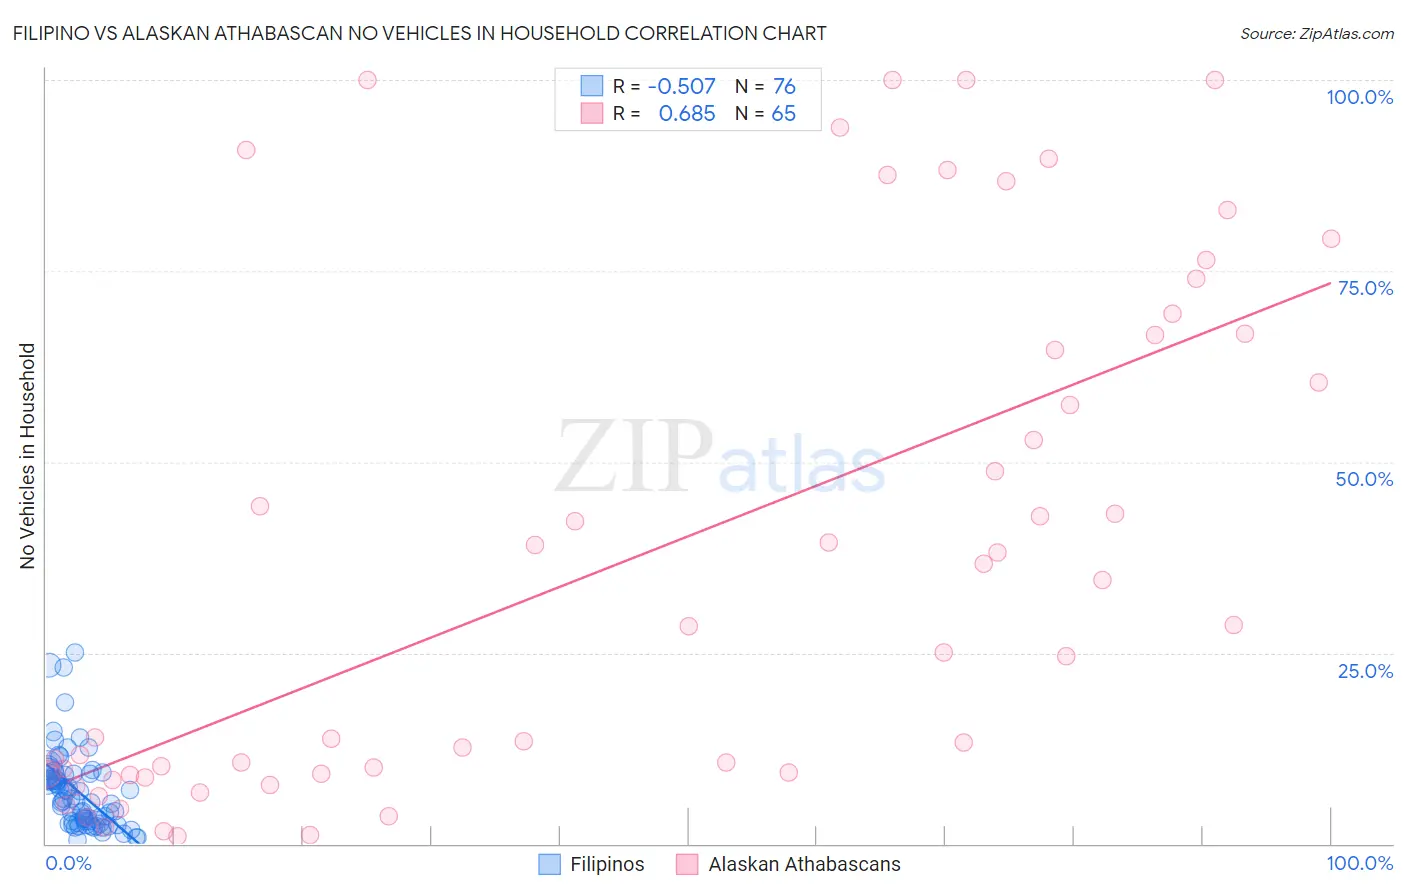
Filipino vs Alaskan Athabascan No Vehicles in Household Correlation Chart
The statistical analysis conducted on geographies consisting of 253,938,776 people shows a substantial negative correlation between the proportion of Filipinos and percentage of households with no vehicle available in the United States with a correlation coefficient (R) of -0.507 and weighted average of 10.4%. Similarly, the statistical analysis conducted on geographies consisting of 45,793,877 people shows a significant positive correlation between the proportion of Alaskan Athabascans and percentage of households with no vehicle available in the United States with a correlation coefficient (R) of 0.685 and weighted average of 15.6%, a difference of 49.9%.
No Vehicles in Household Correlation Summary
| Measurement | Filipino | Alaskan Athabascan |
| Minimum | 0.54% | 1.0% |
| Maximum | 25.0% | 100.0% |
| Range | 24.5% | 99.0% |
| Mean | 6.8% | 37.7% |
| Median | 5.6% | 28.5% |
| Interquartile 25% (IQ1) | 2.9% | 9.1% |
| Interquartile 75% (IQ3) | 9.0% | 66.7% |
| Interquartile Range (IQR) | 6.1% | 57.6% |
| Standard Deviation (Sample) | 5.1% | 33.1% |
| Standard Deviation (Population) | 5.1% | 32.8% |
Similar Demographics by No Vehicles in Household
Demographics Similar to Filipinos by No Vehicles in Household
In terms of no vehicles in household, the demographic groups most similar to Filipinos are Immigrants from Sudan (10.4%, a difference of 0.010%), Immigrants from Burma/Myanmar (10.4%, a difference of 0.13%), French American Indian (10.4%, a difference of 0.13%), Immigrants from El Salvador (10.4%, a difference of 0.14%), and Brazilian (10.4%, a difference of 0.22%).
| Demographics | Rating | Rank | No Vehicles in Household |
| Immigrants | Costa Rica | 60.5 /100 | #166 | Good 10.3% |
| Immigrants | Saudi Arabia | 58.8 /100 | #167 | Average 10.3% |
| Indonesians | 56.7 /100 | #168 | Average 10.3% |
| Lumbee | 54.7 /100 | #169 | Average 10.3% |
| Immigrants | Latin America | 53.2 /100 | #170 | Average 10.4% |
| Hmong | 52.7 /100 | #171 | Average 10.4% |
| Brazilians | 51.7 /100 | #172 | Average 10.4% |
| Filipinos | 50.1 /100 | #173 | Average 10.4% |
| Immigrants | Sudan | 50.0 /100 | #174 | Average 10.4% |
| Immigrants | Burma/Myanmar | 49.1 /100 | #175 | Average 10.4% |
| French American Indians | 49.1 /100 | #176 | Average 10.4% |
| Immigrants | El Salvador | 49.1 /100 | #177 | Average 10.4% |
| Immigrants | Ethiopia | 48.0 /100 | #178 | Average 10.4% |
| Ethiopians | 45.8 /100 | #179 | Average 10.5% |
| Arabs | 45.3 /100 | #180 | Average 10.5% |
Demographics Similar to Alaskan Athabascans by No Vehicles in Household
In terms of no vehicles in household, the demographic groups most similar to Alaskan Athabascans are Immigrants from Israel (15.6%, a difference of 0.15%), Tohono O'odham (15.6%, a difference of 0.15%), Cape Verdean (15.6%, a difference of 0.16%), Albanian (15.6%, a difference of 0.31%), and Cypriot (15.7%, a difference of 0.44%).
| Demographics | Rating | Rank | No Vehicles in Household |
| Immigrants | China | 0.0 /100 | #305 | Tragic 15.2% |
| Immigrants | Belize | 0.0 /100 | #306 | Tragic 15.4% |
| Immigrants | Haiti | 0.0 /100 | #307 | Tragic 15.4% |
| U.S. Virgin Islanders | 0.0 /100 | #308 | Tragic 15.4% |
| Puerto Ricans | 0.0 /100 | #309 | Tragic 15.5% |
| Cape Verdeans | 0.0 /100 | #310 | Tragic 15.6% |
| Immigrants | Israel | 0.0 /100 | #311 | Tragic 15.6% |
| Alaskan Athabascans | 0.0 /100 | #312 | Tragic 15.6% |
| Tohono O'odham | 0.0 /100 | #313 | Tragic 15.6% |
| Albanians | 0.0 /100 | #314 | Tragic 15.6% |
| Cypriots | 0.0 /100 | #315 | Tragic 15.7% |
| Ghanaians | 0.0 /100 | #316 | Tragic 16.4% |
| Immigrants | Ghana | 0.0 /100 | #317 | Tragic 16.6% |
| Immigrants | Belarus | 0.0 /100 | #318 | Tragic 16.7% |
| Alaska Natives | 0.0 /100 | #319 | Tragic 17.4% |