Subsaharan African vs Pima No Vehicles in Household
COMPARE
Subsaharan African
Pima
No Vehicles in Household
No Vehicles in Household Comparison
Sub-Saharan Africans
Pima
12.2%
NO VEHICLES IN HOUSEHOLD
0.6/ 100
METRIC RATING
261st/ 347
METRIC RANK
14.1%
NO VEHICLES IN HOUSEHOLD
0.0/ 100
METRIC RATING
292nd/ 347
METRIC RANK
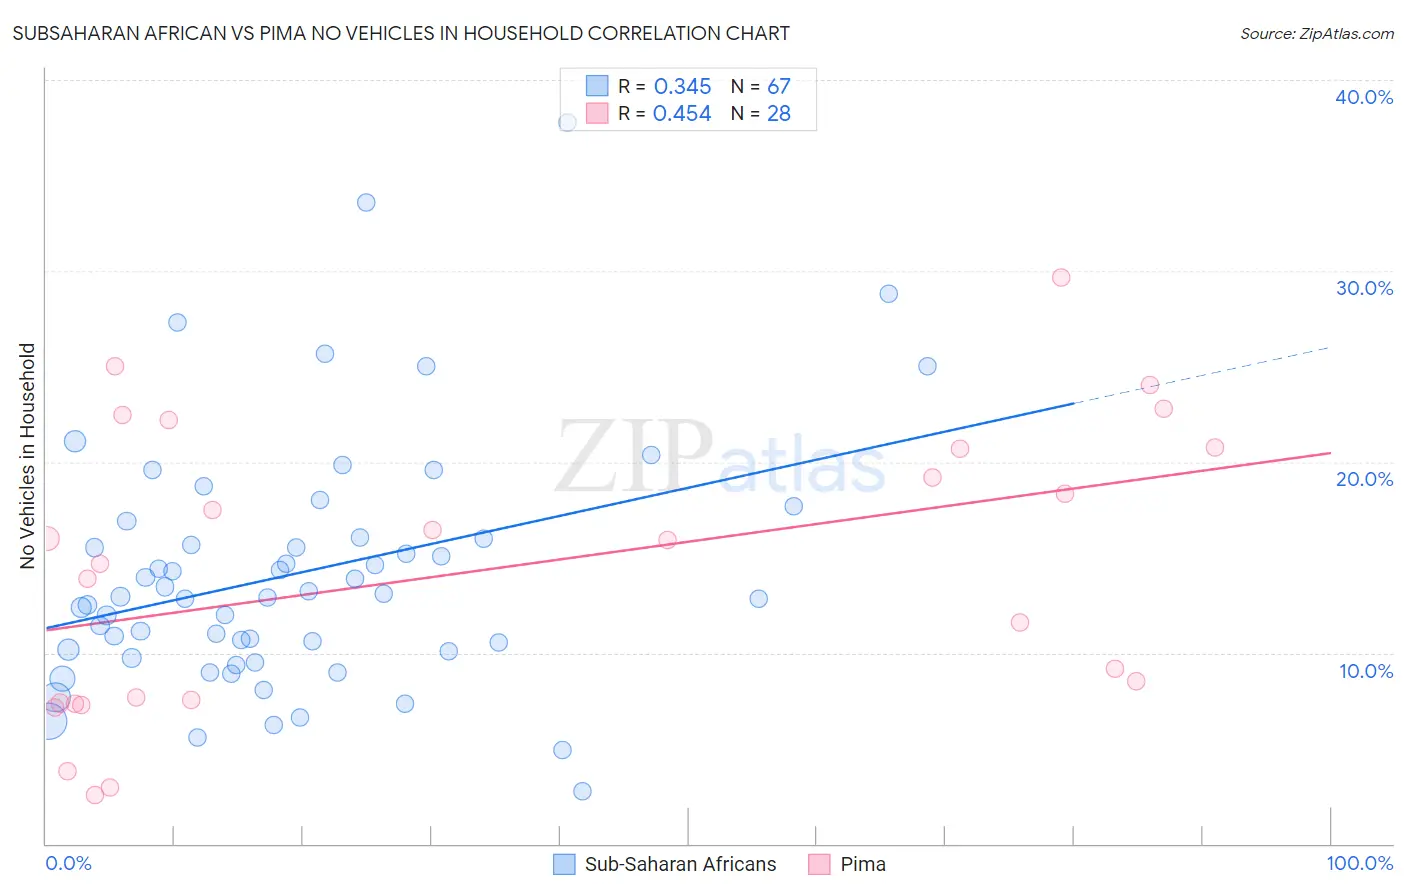
Subsaharan African vs Pima No Vehicles in Household Correlation Chart
The statistical analysis conducted on geographies consisting of 506,014,655 people shows a mild positive correlation between the proportion of Sub-Saharan Africans and percentage of households with no vehicle available in the United States with a correlation coefficient (R) of 0.345 and weighted average of 12.2%. Similarly, the statistical analysis conducted on geographies consisting of 61,491,377 people shows a moderate positive correlation between the proportion of Pima and percentage of households with no vehicle available in the United States with a correlation coefficient (R) of 0.454 and weighted average of 14.1%, a difference of 15.8%.
No Vehicles in Household Correlation Summary
| Measurement | Subsaharan African | Pima |
| Minimum | 2.7% | 2.5% |
| Maximum | 37.8% | 29.6% |
| Range | 35.0% | 27.1% |
| Mean | 14.2% | 14.4% |
| Median | 12.9% | 15.3% |
| Interquartile 25% (IQ1) | 10.1% | 7.4% |
| Interquartile 75% (IQ3) | 16.0% | 20.7% |
| Interquartile Range (IQR) | 5.9% | 13.3% |
| Standard Deviation (Sample) | 6.6% | 7.5% |
| Standard Deviation (Population) | 6.5% | 7.4% |
Similar Demographics by No Vehicles in Household
Demographics Similar to Sub-Saharan Africans by No Vehicles in Household
In terms of no vehicles in household, the demographic groups most similar to Sub-Saharan Africans are Immigrants from Liberia (12.2%, a difference of 0.070%), Immigrants from Egypt (12.2%, a difference of 0.22%), Macedonian (12.2%, a difference of 0.39%), Immigrants from Switzerland (12.3%, a difference of 0.69%), and African (12.3%, a difference of 0.93%).
| Demographics | Rating | Rank | No Vehicles in Household |
| Immigrants | Uruguay | 1.3 /100 | #254 | Tragic 11.9% |
| Hondurans | 1.2 /100 | #255 | Tragic 12.0% |
| Liberians | 1.2 /100 | #256 | Tragic 12.0% |
| Nigerians | 0.9 /100 | #257 | Tragic 12.1% |
| South American Indians | 0.9 /100 | #258 | Tragic 12.1% |
| Immigrants | Latvia | 0.8 /100 | #259 | Tragic 12.1% |
| Macedonians | 0.7 /100 | #260 | Tragic 12.2% |
| Sub-Saharan Africans | 0.6 /100 | #261 | Tragic 12.2% |
| Immigrants | Liberia | 0.6 /100 | #262 | Tragic 12.2% |
| Immigrants | Egypt | 0.6 /100 | #263 | Tragic 12.2% |
| Immigrants | Switzerland | 0.5 /100 | #264 | Tragic 12.3% |
| Africans | 0.4 /100 | #265 | Tragic 12.3% |
| Israelis | 0.3 /100 | #266 | Tragic 12.4% |
| Immigrants | Europe | 0.3 /100 | #267 | Tragic 12.5% |
| Immigrants | Africa | 0.2 /100 | #268 | Tragic 12.5% |
Demographics Similar to Pima by No Vehicles in Household
In terms of no vehicles in household, the demographic groups most similar to Pima are Okinawan (14.1%, a difference of 0.48%), Indian (Asian) (14.1%, a difference of 0.49%), Immigrants from Jamaica (14.2%, a difference of 0.66%), Belizean (14.3%, a difference of 1.5%), and Paraguayan (14.4%, a difference of 1.6%).
| Demographics | Rating | Rank | No Vehicles in Household |
| Immigrants | Eastern Europe | 0.0 /100 | #285 | Tragic 13.6% |
| Colville | 0.0 /100 | #286 | Tragic 13.7% |
| Immigrants | Ireland | 0.0 /100 | #287 | Tragic 13.7% |
| Hopi | 0.0 /100 | #288 | Tragic 13.7% |
| Immigrants | Australia | 0.0 /100 | #289 | Tragic 13.8% |
| Indians (Asian) | 0.0 /100 | #290 | Tragic 14.1% |
| Okinawans | 0.0 /100 | #291 | Tragic 14.1% |
| Pima | 0.0 /100 | #292 | Tragic 14.1% |
| Immigrants | Jamaica | 0.0 /100 | #293 | Tragic 14.2% |
| Belizeans | 0.0 /100 | #294 | Tragic 14.3% |
| Paraguayans | 0.0 /100 | #295 | Tragic 14.4% |
| Immigrants | Spain | 0.0 /100 | #296 | Tragic 14.5% |
| Immigrants | Panama | 0.0 /100 | #297 | Tragic 14.6% |
| Moroccans | 0.0 /100 | #298 | Tragic 14.7% |
| Immigrants | Greece | 0.0 /100 | #299 | Tragic 14.7% |