Immigrants from Trinidad and Tobago vs Alaskan Athabascan No Vehicles in Household
COMPARE
Immigrants from Trinidad and Tobago
Alaskan Athabascan
No Vehicles in Household
No Vehicles in Household Comparison
Immigrants from Trinidad and Tobago
Alaskan Athabascans
24.6%
NO VEHICLES IN HOUSEHOLD
0.0/ 100
METRIC RATING
333rd/ 347
METRIC RANK
15.6%
NO VEHICLES IN HOUSEHOLD
0.0/ 100
METRIC RATING
312th/ 347
METRIC RANK
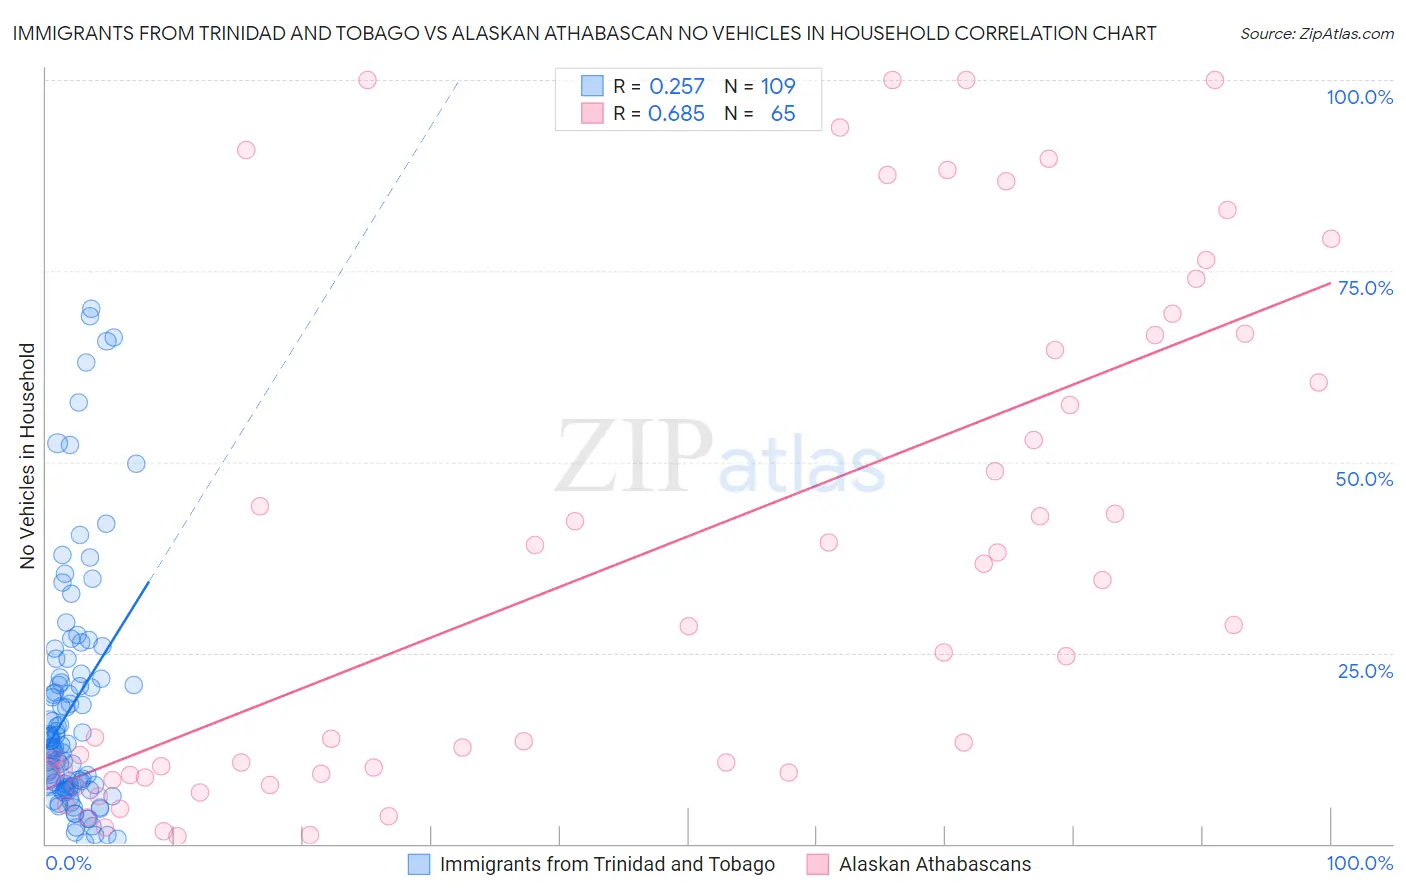
Immigrants from Trinidad and Tobago vs Alaskan Athabascan No Vehicles in Household Correlation Chart
The statistical analysis conducted on geographies consisting of 223,315,906 people shows a weak positive correlation between the proportion of Immigrants from Trinidad and Tobago and percentage of households with no vehicle available in the United States with a correlation coefficient (R) of 0.257 and weighted average of 24.6%. Similarly, the statistical analysis conducted on geographies consisting of 45,793,877 people shows a significant positive correlation between the proportion of Alaskan Athabascans and percentage of households with no vehicle available in the United States with a correlation coefficient (R) of 0.685 and weighted average of 15.6%, a difference of 57.9%.
No Vehicles in Household Correlation Summary
| Measurement | Immigrants from Trinidad and Tobago | Alaskan Athabascan |
| Minimum | 0.21% | 1.0% |
| Maximum | 70.0% | 100.0% |
| Range | 69.8% | 99.0% |
| Mean | 18.1% | 37.7% |
| Median | 13.0% | 28.5% |
| Interquartile 25% (IQ1) | 7.4% | 9.1% |
| Interquartile 75% (IQ3) | 22.0% | 66.7% |
| Interquartile Range (IQR) | 14.6% | 57.6% |
| Standard Deviation (Sample) | 16.0% | 33.1% |
| Standard Deviation (Population) | 15.9% | 32.8% |
Similar Demographics by No Vehicles in Household
Demographics Similar to Immigrants from Trinidad and Tobago by No Vehicles in Household
In terms of no vehicles in household, the demographic groups most similar to Immigrants from Trinidad and Tobago are Immigrants from Ecuador (23.8%, a difference of 3.4%), Trinidadian and Tobagonian (23.7%, a difference of 3.7%), West Indian (23.7%, a difference of 3.9%), Immigrants from Bangladesh (25.8%, a difference of 4.5%), and Barbadian (26.1%, a difference of 5.9%).
| Demographics | Rating | Rank | No Vehicles in Household |
| Immigrants | West Indies | 0.0 /100 | #326 | Tragic 20.5% |
| Immigrants | Senegal | 0.0 /100 | #327 | Tragic 21.1% |
| Immigrants | Dominica | 0.0 /100 | #328 | Tragic 22.2% |
| Ecuadorians | 0.0 /100 | #329 | Tragic 22.8% |
| West Indians | 0.0 /100 | #330 | Tragic 23.7% |
| Trinidadians and Tobagonians | 0.0 /100 | #331 | Tragic 23.7% |
| Immigrants | Ecuador | 0.0 /100 | #332 | Tragic 23.8% |
| Immigrants | Trinidad and Tobago | 0.0 /100 | #333 | Tragic 24.6% |
| Immigrants | Bangladesh | 0.0 /100 | #334 | Tragic 25.8% |
| Barbadians | 0.0 /100 | #335 | Tragic 26.1% |
| Vietnamese | 0.0 /100 | #336 | Tragic 26.2% |
| Immigrants | Uzbekistan | 0.0 /100 | #337 | Tragic 26.7% |
| Guyanese | 0.0 /100 | #338 | Tragic 29.3% |
| Dominicans | 0.0 /100 | #339 | Tragic 29.4% |
| Immigrants | Barbados | 0.0 /100 | #340 | Tragic 29.5% |
Demographics Similar to Alaskan Athabascans by No Vehicles in Household
In terms of no vehicles in household, the demographic groups most similar to Alaskan Athabascans are Immigrants from Israel (15.6%, a difference of 0.15%), Tohono O'odham (15.6%, a difference of 0.15%), Cape Verdean (15.6%, a difference of 0.16%), Albanian (15.6%, a difference of 0.31%), and Cypriot (15.7%, a difference of 0.44%).
| Demographics | Rating | Rank | No Vehicles in Household |
| Immigrants | China | 0.0 /100 | #305 | Tragic 15.2% |
| Immigrants | Belize | 0.0 /100 | #306 | Tragic 15.4% |
| Immigrants | Haiti | 0.0 /100 | #307 | Tragic 15.4% |
| U.S. Virgin Islanders | 0.0 /100 | #308 | Tragic 15.4% |
| Puerto Ricans | 0.0 /100 | #309 | Tragic 15.5% |
| Cape Verdeans | 0.0 /100 | #310 | Tragic 15.6% |
| Immigrants | Israel | 0.0 /100 | #311 | Tragic 15.6% |
| Alaskan Athabascans | 0.0 /100 | #312 | Tragic 15.6% |
| Tohono O'odham | 0.0 /100 | #313 | Tragic 15.6% |
| Albanians | 0.0 /100 | #314 | Tragic 15.6% |
| Cypriots | 0.0 /100 | #315 | Tragic 15.7% |
| Ghanaians | 0.0 /100 | #316 | Tragic 16.4% |
| Immigrants | Ghana | 0.0 /100 | #317 | Tragic 16.6% |
| Immigrants | Belarus | 0.0 /100 | #318 | Tragic 16.7% |
| Alaska Natives | 0.0 /100 | #319 | Tragic 17.4% |