Spanish American vs Puget Sound Salish 3 or more Vehicles in Household
COMPARE
Spanish American
Puget Sound Salish
3 or more Vehicles in Household
3 or more Vehicles in Household Comparison
Spanish Americans
Puget Sound Salish
23.0%
3 OR MORE VEHICLES IN HOUSEHOLD
100.0/ 100
METRIC RATING
33rd/ 347
METRIC RANK
26.4%
3 OR MORE VEHICLES IN HOUSEHOLD
100.0/ 100
METRIC RATING
5th/ 347
METRIC RANK
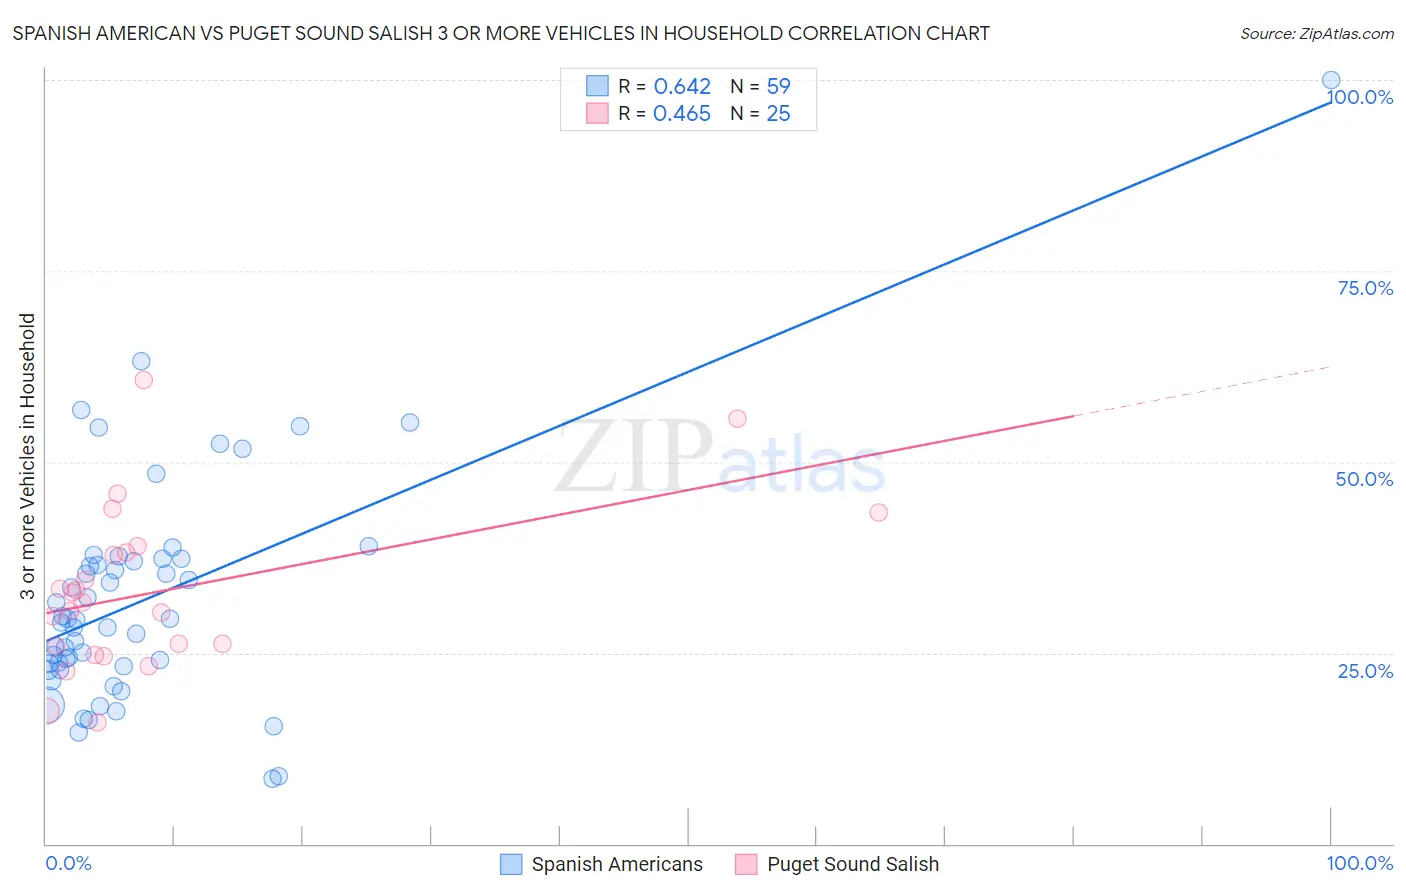
Spanish American vs Puget Sound Salish 3 or more Vehicles in Household Correlation Chart
The statistical analysis conducted on geographies consisting of 103,168,496 people shows a significant positive correlation between the proportion of Spanish Americans and percentage of households with 3 or more vehicles available in the United States with a correlation coefficient (R) of 0.642 and weighted average of 23.0%. Similarly, the statistical analysis conducted on geographies consisting of 46,155,628 people shows a moderate positive correlation between the proportion of Puget Sound Salish and percentage of households with 3 or more vehicles available in the United States with a correlation coefficient (R) of 0.465 and weighted average of 26.4%, a difference of 14.5%.
3 or more Vehicles in Household Correlation Summary
| Measurement | Spanish American | Puget Sound Salish |
| Minimum | 8.5% | 15.8% |
| Maximum | 100.0% | 60.7% |
| Range | 91.5% | 44.8% |
| Mean | 32.0% | 33.1% |
| Median | 29.3% | 31.6% |
| Interquartile 25% (IQ1) | 23.3% | 25.3% |
| Interquartile 75% (IQ3) | 37.2% | 38.5% |
| Interquartile Range (IQR) | 13.9% | 13.2% |
| Standard Deviation (Sample) | 15.1% | 10.8% |
| Standard Deviation (Population) | 14.9% | 10.6% |
Similar Demographics by 3 or more Vehicles in Household
Demographics Similar to Spanish Americans by 3 or more Vehicles in Household
In terms of 3 or more vehicles in household, the demographic groups most similar to Spanish Americans are Swiss (23.0%, a difference of 0.050%), Pueblo (23.0%, a difference of 0.060%), Choctaw (23.0%, a difference of 0.070%), Cherokee (23.0%, a difference of 0.11%), and Swedish (23.0%, a difference of 0.14%).
| Demographics | Rating | Rank | 3 or more Vehicles in Household |
| Mexican American Indians | 100.0 /100 | #26 | Exceptional 23.3% |
| Guamanians/Chamorros | 100.0 /100 | #27 | Exceptional 23.2% |
| Lumbee | 100.0 /100 | #28 | Exceptional 23.1% |
| Spanish | 100.0 /100 | #29 | Exceptional 23.1% |
| Immigrants | South Eastern Asia | 100.0 /100 | #30 | Exceptional 23.1% |
| English | 100.0 /100 | #31 | Exceptional 23.1% |
| Pueblo | 100.0 /100 | #32 | Exceptional 23.0% |
| Spanish Americans | 100.0 /100 | #33 | Exceptional 23.0% |
| Swiss | 100.0 /100 | #34 | Exceptional 23.0% |
| Choctaw | 100.0 /100 | #35 | Exceptional 23.0% |
| Cherokee | 100.0 /100 | #36 | Exceptional 23.0% |
| Swedes | 100.0 /100 | #37 | Exceptional 23.0% |
| Dutch | 100.0 /100 | #38 | Exceptional 22.9% |
| Yaqui | 100.0 /100 | #39 | Exceptional 22.9% |
| Europeans | 100.0 /100 | #40 | Exceptional 22.9% |
Demographics Similar to Puget Sound Salish by 3 or more Vehicles in Household
In terms of 3 or more vehicles in household, the demographic groups most similar to Puget Sound Salish are Arapaho (26.4%, a difference of 0.34%), Tongan (26.5%, a difference of 0.67%), Immigrants from Fiji (26.1%, a difference of 1.2%), Spanish American Indian (26.9%, a difference of 2.2%), and Colville (25.8%, a difference of 2.3%).
| Demographics | Rating | Rank | 3 or more Vehicles in Household |
| Yakama | 100.0 /100 | #1 | Exceptional 31.0% |
| Spanish American Indians | 100.0 /100 | #2 | Exceptional 26.9% |
| Tongans | 100.0 /100 | #3 | Exceptional 26.5% |
| Arapaho | 100.0 /100 | #4 | Exceptional 26.4% |
| Puget Sound Salish | 100.0 /100 | #5 | Exceptional 26.4% |
| Immigrants | Fiji | 100.0 /100 | #6 | Exceptional 26.1% |
| Colville | 100.0 /100 | #7 | Exceptional 25.8% |
| Samoans | 100.0 /100 | #8 | Exceptional 25.0% |
| Native Hawaiians | 100.0 /100 | #9 | Exceptional 24.9% |
| Nepalese | 100.0 /100 | #10 | Exceptional 24.9% |
| Shoshone | 100.0 /100 | #11 | Exceptional 24.9% |
| Danes | 100.0 /100 | #12 | Exceptional 24.7% |
| Mexicans | 100.0 /100 | #13 | Exceptional 24.7% |
| Immigrants | Mexico | 100.0 /100 | #14 | Exceptional 24.6% |
| Hawaiians | 100.0 /100 | #15 | Exceptional 24.3% |