South American vs Carpatho Rusyn 2 or more Vehicles in Household
COMPARE
South American
Carpatho Rusyn
2 or more Vehicles in Household
2 or more Vehicles in Household Comparison
South Americans
Carpatho Rusyns
51.9%
2 OR MORE VEHICLES IN HOUSEHOLD
0.2/ 100
METRIC RATING
271st/ 347
METRIC RANK
54.4%
2 OR MORE VEHICLES IN HOUSEHOLD
16.2/ 100
METRIC RATING
198th/ 347
METRIC RANK
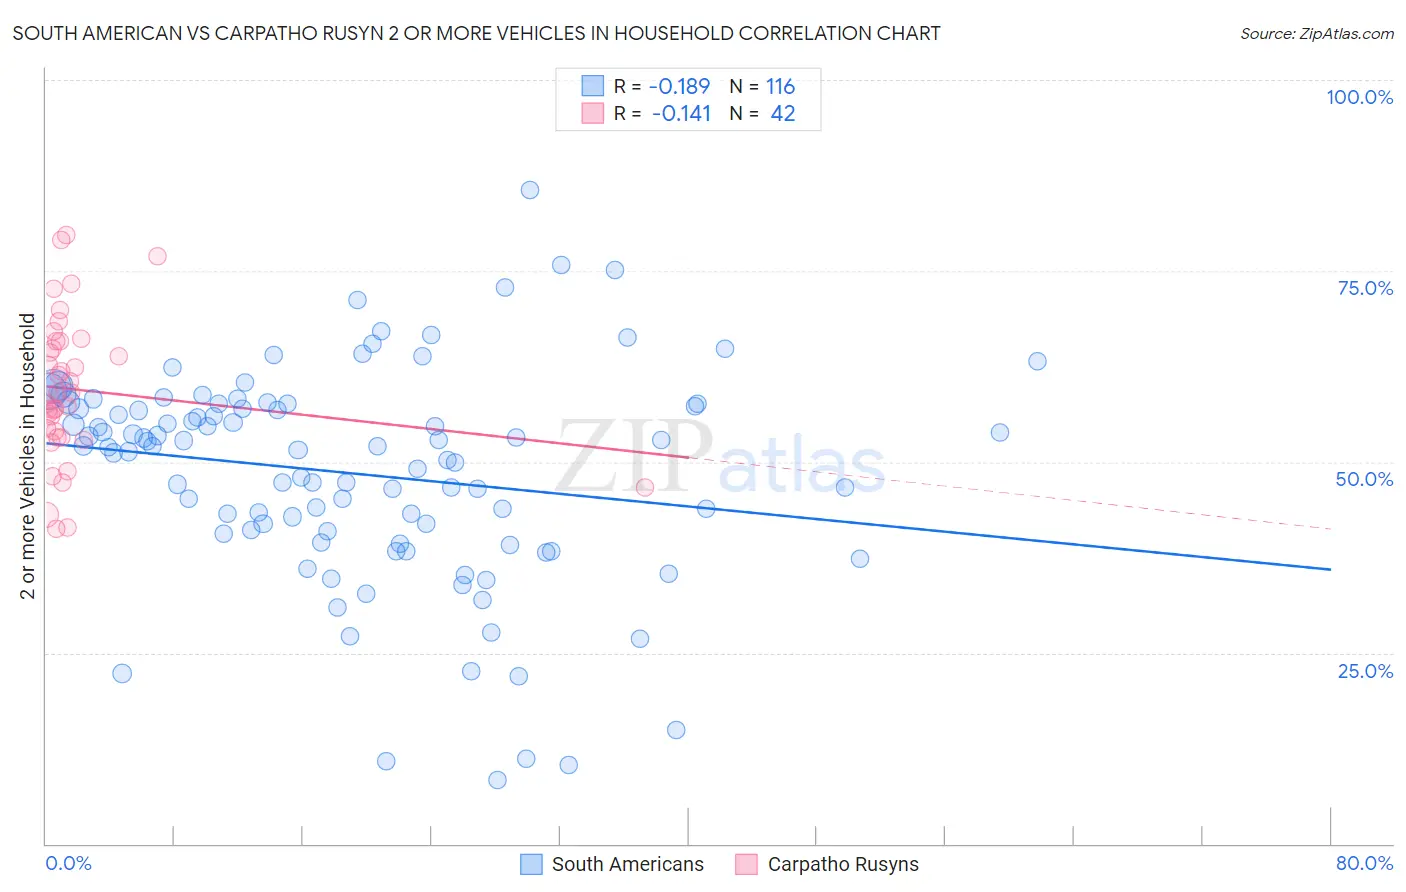
South American vs Carpatho Rusyn 2 or more Vehicles in Household Correlation Chart
The statistical analysis conducted on geographies consisting of 493,722,919 people shows a poor negative correlation between the proportion of South Americans and percentage of households with 2 or more vehicles available in the United States with a correlation coefficient (R) of -0.189 and weighted average of 51.9%. Similarly, the statistical analysis conducted on geographies consisting of 58,871,690 people shows a poor negative correlation between the proportion of Carpatho Rusyns and percentage of households with 2 or more vehicles available in the United States with a correlation coefficient (R) of -0.141 and weighted average of 54.4%, a difference of 4.9%.
2 or more Vehicles in Household Correlation Summary
| Measurement | South American | Carpatho Rusyn |
| Minimum | 8.3% | 41.3% |
| Maximum | 85.6% | 79.7% |
| Range | 77.2% | 38.5% |
| Mean | 48.5% | 59.5% |
| Median | 52.0% | 58.9% |
| Interquartile 25% (IQ1) | 40.8% | 53.2% |
| Interquartile 75% (IQ3) | 57.4% | 65.8% |
| Interquartile Range (IQR) | 16.7% | 12.6% |
| Standard Deviation (Sample) | 14.1% | 9.5% |
| Standard Deviation (Population) | 14.0% | 9.4% |
Similar Demographics by 2 or more Vehicles in Household
Demographics Similar to South Americans by 2 or more Vehicles in Household
In terms of 2 or more vehicles in household, the demographic groups most similar to South Americans are Subsaharan African (51.9%, a difference of 0.020%), Israeli (51.9%, a difference of 0.12%), African (51.8%, a difference of 0.16%), Immigrants from Ireland (52.0%, a difference of 0.17%), and Immigrants from Honduras (51.8%, a difference of 0.18%).
| Demographics | Rating | Rank | 2 or more Vehicles in Household |
| Immigrants | Latvia | 0.4 /100 | #264 | Tragic 52.2% |
| Immigrants | Congo | 0.3 /100 | #265 | Tragic 52.1% |
| Immigrants | France | 0.2 /100 | #266 | Tragic 52.0% |
| Immigrants | Colombia | 0.2 /100 | #267 | Tragic 52.0% |
| Pima | 0.2 /100 | #268 | Tragic 52.0% |
| Hondurans | 0.2 /100 | #269 | Tragic 52.0% |
| Immigrants | Ireland | 0.2 /100 | #270 | Tragic 52.0% |
| South Americans | 0.2 /100 | #271 | Tragic 51.9% |
| Sub-Saharan Africans | 0.2 /100 | #272 | Tragic 51.9% |
| Israelis | 0.2 /100 | #273 | Tragic 51.9% |
| Africans | 0.2 /100 | #274 | Tragic 51.8% |
| Immigrants | Honduras | 0.2 /100 | #275 | Tragic 51.8% |
| Immigrants | Croatia | 0.2 /100 | #276 | Tragic 51.8% |
| Immigrants | Africa | 0.2 /100 | #277 | Tragic 51.8% |
| Yuman | 0.1 /100 | #278 | Tragic 51.7% |
Demographics Similar to Carpatho Rusyns by 2 or more Vehicles in Household
In terms of 2 or more vehicles in household, the demographic groups most similar to Carpatho Rusyns are Immigrants from Norway (54.4%, a difference of 0.030%), Houma (54.4%, a difference of 0.030%), Immigrants from Italy (54.4%, a difference of 0.060%), Argentinean (54.5%, a difference of 0.090%), and Immigrants from North Macedonia (54.4%, a difference of 0.11%).
| Demographics | Rating | Rank | 2 or more Vehicles in Household |
| Immigrants | Immigrants | 25.0 /100 | #191 | Fair 54.7% |
| Immigrants | Romania | 23.8 /100 | #192 | Fair 54.7% |
| Immigrants | Japan | 23.4 /100 | #193 | Fair 54.7% |
| Central Americans | 23.0 /100 | #194 | Fair 54.7% |
| Iroquois | 22.6 /100 | #195 | Fair 54.7% |
| Immigrants | Poland | 19.3 /100 | #196 | Poor 54.6% |
| Argentineans | 17.5 /100 | #197 | Poor 54.5% |
| Carpatho Rusyns | 16.2 /100 | #198 | Poor 54.4% |
| Immigrants | Norway | 15.9 /100 | #199 | Poor 54.4% |
| Houma | 15.8 /100 | #200 | Poor 54.4% |
| Immigrants | Italy | 15.5 /100 | #201 | Poor 54.4% |
| Immigrants | North Macedonia | 14.9 /100 | #202 | Poor 54.4% |
| Immigrants | Peru | 14.3 /100 | #203 | Poor 54.4% |
| Immigrants | Belgium | 13.7 /100 | #204 | Poor 54.3% |
| Cheyenne | 13.6 /100 | #205 | Poor 54.3% |