Taiwanese vs Carpatho Rusyn 2 or more Vehicles in Household
COMPARE
Taiwanese
Carpatho Rusyn
2 or more Vehicles in Household
2 or more Vehicles in Household Comparison
Taiwanese
Carpatho Rusyns
53.9%
2 OR MORE VEHICLES IN HOUSEHOLD
6.3/ 100
METRIC RATING
220th/ 347
METRIC RANK
54.4%
2 OR MORE VEHICLES IN HOUSEHOLD
16.2/ 100
METRIC RATING
198th/ 347
METRIC RANK
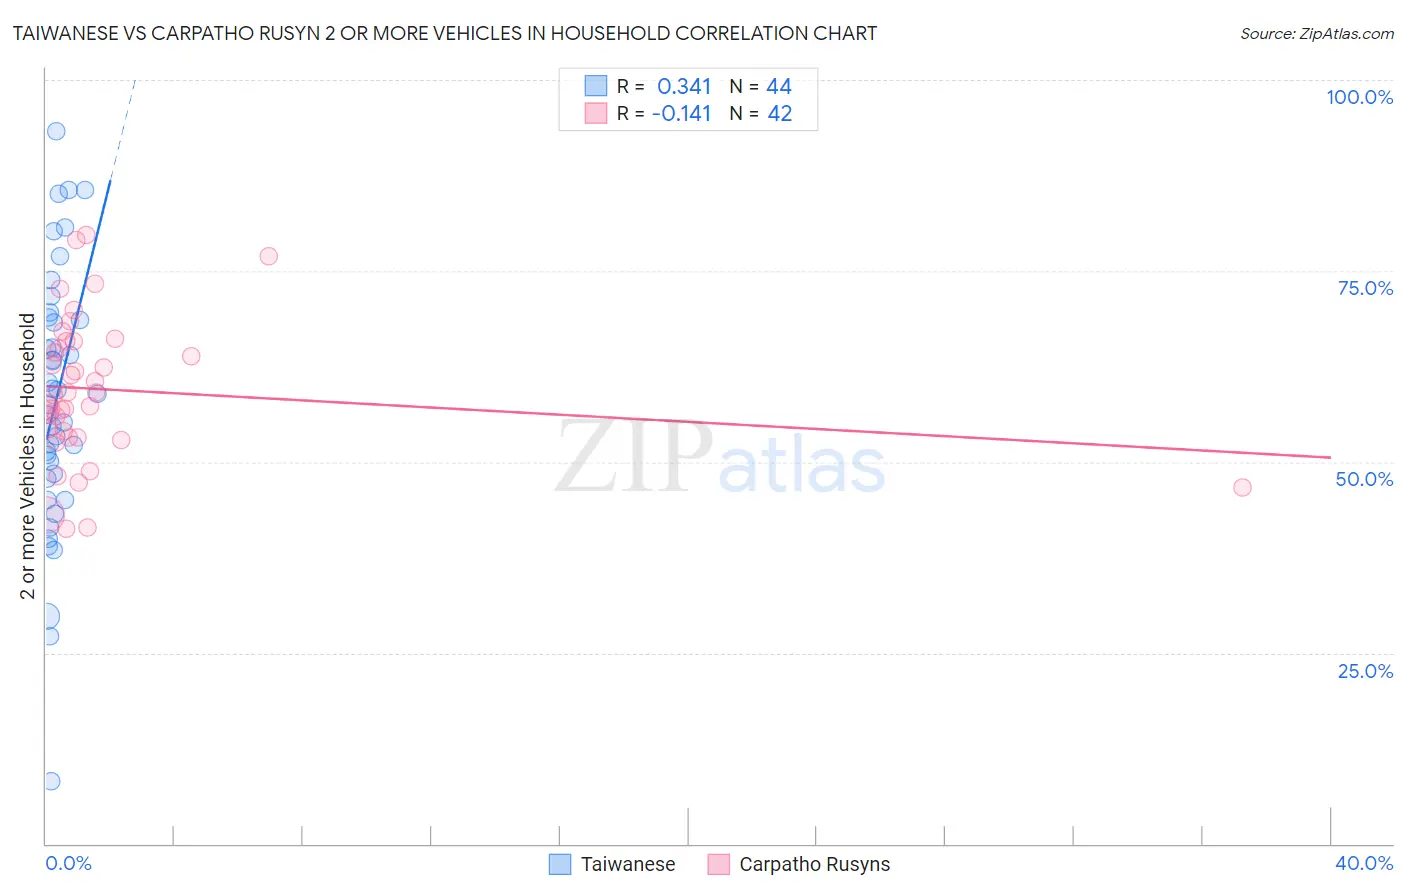
Taiwanese vs Carpatho Rusyn 2 or more Vehicles in Household Correlation Chart
The statistical analysis conducted on geographies consisting of 31,715,954 people shows a mild positive correlation between the proportion of Taiwanese and percentage of households with 2 or more vehicles available in the United States with a correlation coefficient (R) of 0.341 and weighted average of 53.9%. Similarly, the statistical analysis conducted on geographies consisting of 58,871,690 people shows a poor negative correlation between the proportion of Carpatho Rusyns and percentage of households with 2 or more vehicles available in the United States with a correlation coefficient (R) of -0.141 and weighted average of 54.4%, a difference of 1.1%.
2 or more Vehicles in Household Correlation Summary
| Measurement | Taiwanese | Carpatho Rusyn |
| Minimum | 8.2% | 41.3% |
| Maximum | 93.3% | 79.7% |
| Range | 85.2% | 38.5% |
| Mean | 58.0% | 59.5% |
| Median | 58.2% | 58.9% |
| Interquartile 25% (IQ1) | 48.1% | 53.2% |
| Interquartile 75% (IQ3) | 68.8% | 65.8% |
| Interquartile Range (IQR) | 20.6% | 12.6% |
| Standard Deviation (Sample) | 17.1% | 9.5% |
| Standard Deviation (Population) | 16.9% | 9.4% |
Similar Demographics by 2 or more Vehicles in Household
Demographics Similar to Taiwanese by 2 or more Vehicles in Household
In terms of 2 or more vehicles in household, the demographic groups most similar to Taiwanese are Immigrants from Singapore (53.9%, a difference of 0.010%), South American Indian (53.9%, a difference of 0.020%), Kiowa (53.9%, a difference of 0.030%), Immigrants from Argentina (53.9%, a difference of 0.080%), and Immigrants from Burma/Myanmar (53.9%, a difference of 0.13%).
| Demographics | Rating | Rank | 2 or more Vehicles in Household |
| Guatemalans | 9.6 /100 | #213 | Tragic 54.1% |
| Immigrants | Czechoslovakia | 9.4 /100 | #214 | Tragic 54.1% |
| Aleuts | 9.3 /100 | #215 | Tragic 54.1% |
| Immigrants | Western Asia | 9.3 /100 | #216 | Tragic 54.1% |
| Immigrants | Burma/Myanmar | 7.1 /100 | #217 | Tragic 53.9% |
| Immigrants | Argentina | 6.8 /100 | #218 | Tragic 53.9% |
| South American Indians | 6.5 /100 | #219 | Tragic 53.9% |
| Taiwanese | 6.3 /100 | #220 | Tragic 53.9% |
| Immigrants | Singapore | 6.3 /100 | #221 | Tragic 53.9% |
| Kiowa | 6.2 /100 | #222 | Tragic 53.9% |
| Immigrants | Bosnia and Herzegovina | 5.5 /100 | #223 | Tragic 53.8% |
| Brazilians | 5.3 /100 | #224 | Tragic 53.8% |
| Immigrants | Egypt | 5.2 /100 | #225 | Tragic 53.8% |
| Immigrants | Eastern Africa | 5.1 /100 | #226 | Tragic 53.7% |
| Sudanese | 4.1 /100 | #227 | Tragic 53.6% |
Demographics Similar to Carpatho Rusyns by 2 or more Vehicles in Household
In terms of 2 or more vehicles in household, the demographic groups most similar to Carpatho Rusyns are Immigrants from Norway (54.4%, a difference of 0.030%), Houma (54.4%, a difference of 0.030%), Immigrants from Italy (54.4%, a difference of 0.060%), Argentinean (54.5%, a difference of 0.090%), and Immigrants from North Macedonia (54.4%, a difference of 0.11%).
| Demographics | Rating | Rank | 2 or more Vehicles in Household |
| Immigrants | Immigrants | 25.0 /100 | #191 | Fair 54.7% |
| Immigrants | Romania | 23.8 /100 | #192 | Fair 54.7% |
| Immigrants | Japan | 23.4 /100 | #193 | Fair 54.7% |
| Central Americans | 23.0 /100 | #194 | Fair 54.7% |
| Iroquois | 22.6 /100 | #195 | Fair 54.7% |
| Immigrants | Poland | 19.3 /100 | #196 | Poor 54.6% |
| Argentineans | 17.5 /100 | #197 | Poor 54.5% |
| Carpatho Rusyns | 16.2 /100 | #198 | Poor 54.4% |
| Immigrants | Norway | 15.9 /100 | #199 | Poor 54.4% |
| Houma | 15.8 /100 | #200 | Poor 54.4% |
| Immigrants | Italy | 15.5 /100 | #201 | Poor 54.4% |
| Immigrants | North Macedonia | 14.9 /100 | #202 | Poor 54.4% |
| Immigrants | Peru | 14.3 /100 | #203 | Poor 54.4% |
| Immigrants | Belgium | 13.7 /100 | #204 | Poor 54.3% |
| Cheyenne | 13.6 /100 | #205 | Poor 54.3% |