South American vs Carpatho Rusyn Family Poverty
COMPARE
South American
Carpatho Rusyn
Family Poverty
Family Poverty Comparison
South Americans
Carpatho Rusyns
9.3%
FAMILY POVERTY
28.1/ 100
METRIC RATING
194th/ 347
METRIC RANK
7.5%
FAMILY POVERTY
99.3/ 100
METRIC RATING
39th/ 347
METRIC RANK
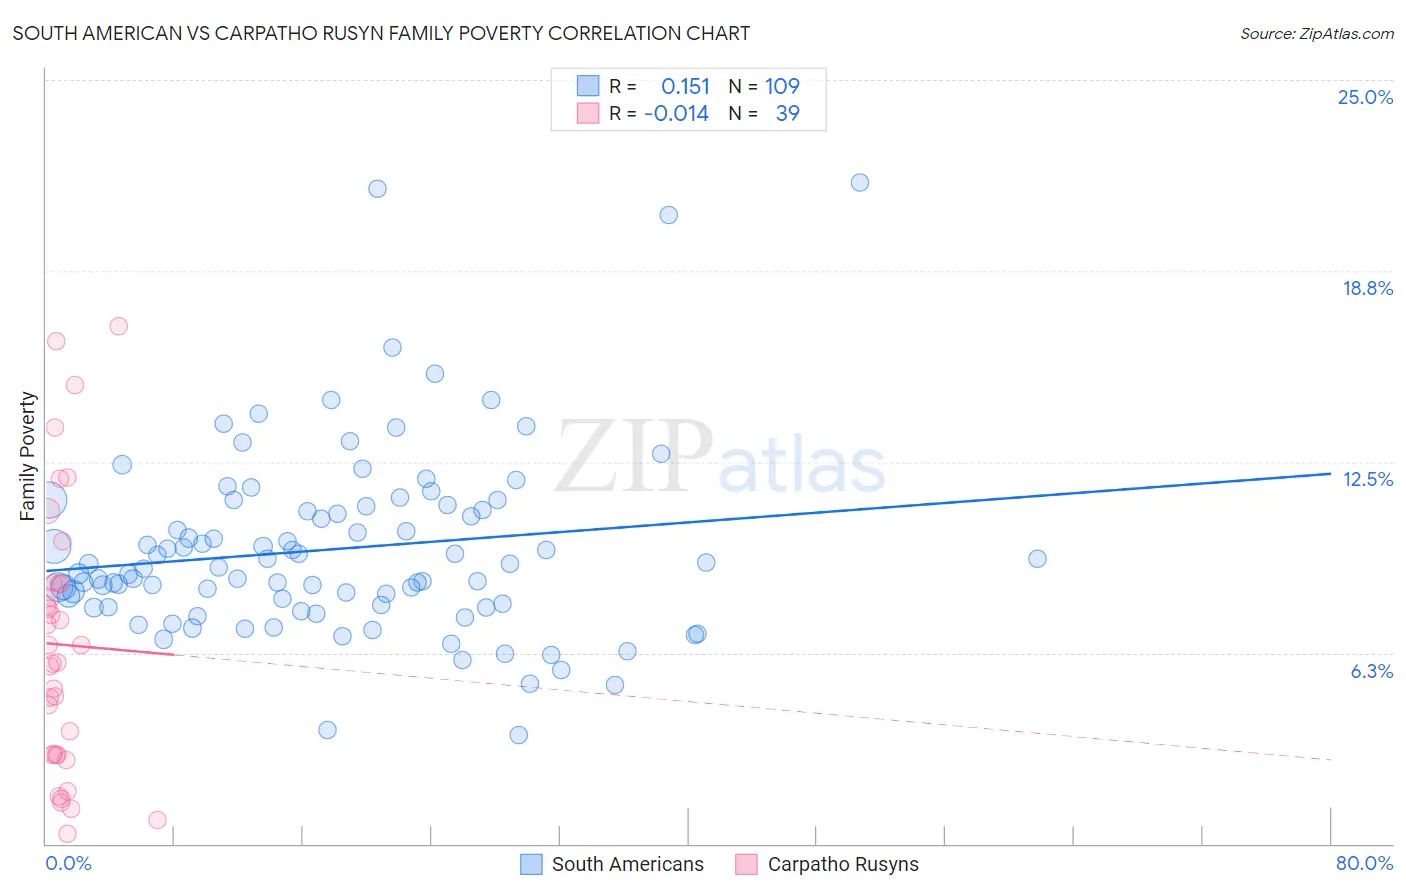
South American vs Carpatho Rusyn Family Poverty Correlation Chart
The statistical analysis conducted on geographies consisting of 491,953,900 people shows a poor positive correlation between the proportion of South Americans and poverty level among families in the United States with a correlation coefficient (R) of 0.151 and weighted average of 9.3%. Similarly, the statistical analysis conducted on geographies consisting of 58,816,515 people shows no correlation between the proportion of Carpatho Rusyns and poverty level among families in the United States with a correlation coefficient (R) of -0.014 and weighted average of 7.5%, a difference of 23.1%.
Family Poverty Correlation Summary
| Measurement | South American | Carpatho Rusyn |
| Minimum | 3.6% | 0.31% |
| Maximum | 21.7% | 16.9% |
| Range | 18.1% | 16.6% |
| Mean | 9.6% | 6.5% |
| Median | 9.0% | 5.9% |
| Interquartile 25% (IQ1) | 7.8% | 2.9% |
| Interquartile 75% (IQ3) | 11.0% | 8.5% |
| Interquartile Range (IQR) | 3.2% | 5.6% |
| Standard Deviation (Sample) | 3.1% | 4.4% |
| Standard Deviation (Population) | 3.1% | 4.3% |
Similar Demographics by Family Poverty
Demographics Similar to South Americans by Family Poverty
In terms of family poverty, the demographic groups most similar to South Americans are Immigrants from Western Asia (9.3%, a difference of 0.020%), Spanish (9.3%, a difference of 0.090%), Ugandan (9.3%, a difference of 0.10%), Venezuelan (9.3%, a difference of 0.12%), and Immigrants from Venezuela (9.3%, a difference of 0.33%).
| Demographics | Rating | Rank | Family Poverty |
| Delaware | 35.4 /100 | #187 | Fair 9.2% |
| Immigrants | Kenya | 34.0 /100 | #188 | Fair 9.2% |
| Immigrants | Afghanistan | 32.1 /100 | #189 | Fair 9.2% |
| Arabs | 31.5 /100 | #190 | Fair 9.2% |
| Ugandans | 28.7 /100 | #191 | Fair 9.3% |
| Spanish | 28.7 /100 | #192 | Fair 9.3% |
| Immigrants | Western Asia | 28.2 /100 | #193 | Fair 9.3% |
| South Americans | 28.1 /100 | #194 | Fair 9.3% |
| Venezuelans | 27.4 /100 | #195 | Fair 9.3% |
| Immigrants | Venezuela | 26.1 /100 | #196 | Fair 9.3% |
| Immigrants | Colombia | 24.4 /100 | #197 | Fair 9.3% |
| Iraqis | 24.2 /100 | #198 | Fair 9.3% |
| Spaniards | 22.8 /100 | #199 | Fair 9.4% |
| Immigrants | Costa Rica | 21.7 /100 | #200 | Fair 9.4% |
| Immigrants | Portugal | 20.5 /100 | #201 | Fair 9.4% |
Demographics Similar to Carpatho Rusyns by Family Poverty
In terms of family poverty, the demographic groups most similar to Carpatho Rusyns are Slovene (7.5%, a difference of 0.040%), Bolivian (7.5%, a difference of 0.060%), Estonian (7.5%, a difference of 0.31%), Immigrants from Australia (7.6%, a difference of 0.34%), and Turkish (7.5%, a difference of 0.47%).
| Demographics | Rating | Rank | Family Poverty |
| Poles | 99.5 /100 | #32 | Exceptional 7.4% |
| Immigrants | Japan | 99.5 /100 | #33 | Exceptional 7.4% |
| Russians | 99.5 /100 | #34 | Exceptional 7.5% |
| Greeks | 99.4 /100 | #35 | Exceptional 7.5% |
| Turks | 99.4 /100 | #36 | Exceptional 7.5% |
| Estonians | 99.4 /100 | #37 | Exceptional 7.5% |
| Bolivians | 99.3 /100 | #38 | Exceptional 7.5% |
| Carpatho Rusyns | 99.3 /100 | #39 | Exceptional 7.5% |
| Slovenes | 99.3 /100 | #40 | Exceptional 7.5% |
| Immigrants | Australia | 99.2 /100 | #41 | Exceptional 7.6% |
| Scandinavians | 99.1 /100 | #42 | Exceptional 7.6% |
| Immigrants | Austria | 99.1 /100 | #43 | Exceptional 7.6% |
| Germans | 99.0 /100 | #44 | Exceptional 7.7% |
| Okinawans | 98.9 /100 | #45 | Exceptional 7.7% |
| Tongans | 98.9 /100 | #46 | Exceptional 7.7% |