South American vs Romanian 2 or more Vehicles in Household
COMPARE
South American
Romanian
2 or more Vehicles in Household
2 or more Vehicles in Household Comparison
South Americans
Romanians
51.9%
2 OR MORE VEHICLES IN HOUSEHOLD
0.2/ 100
METRIC RATING
271st/ 347
METRIC RANK
55.5%
2 OR MORE VEHICLES IN HOUSEHOLD
55.8/ 100
METRIC RATING
170th/ 347
METRIC RANK
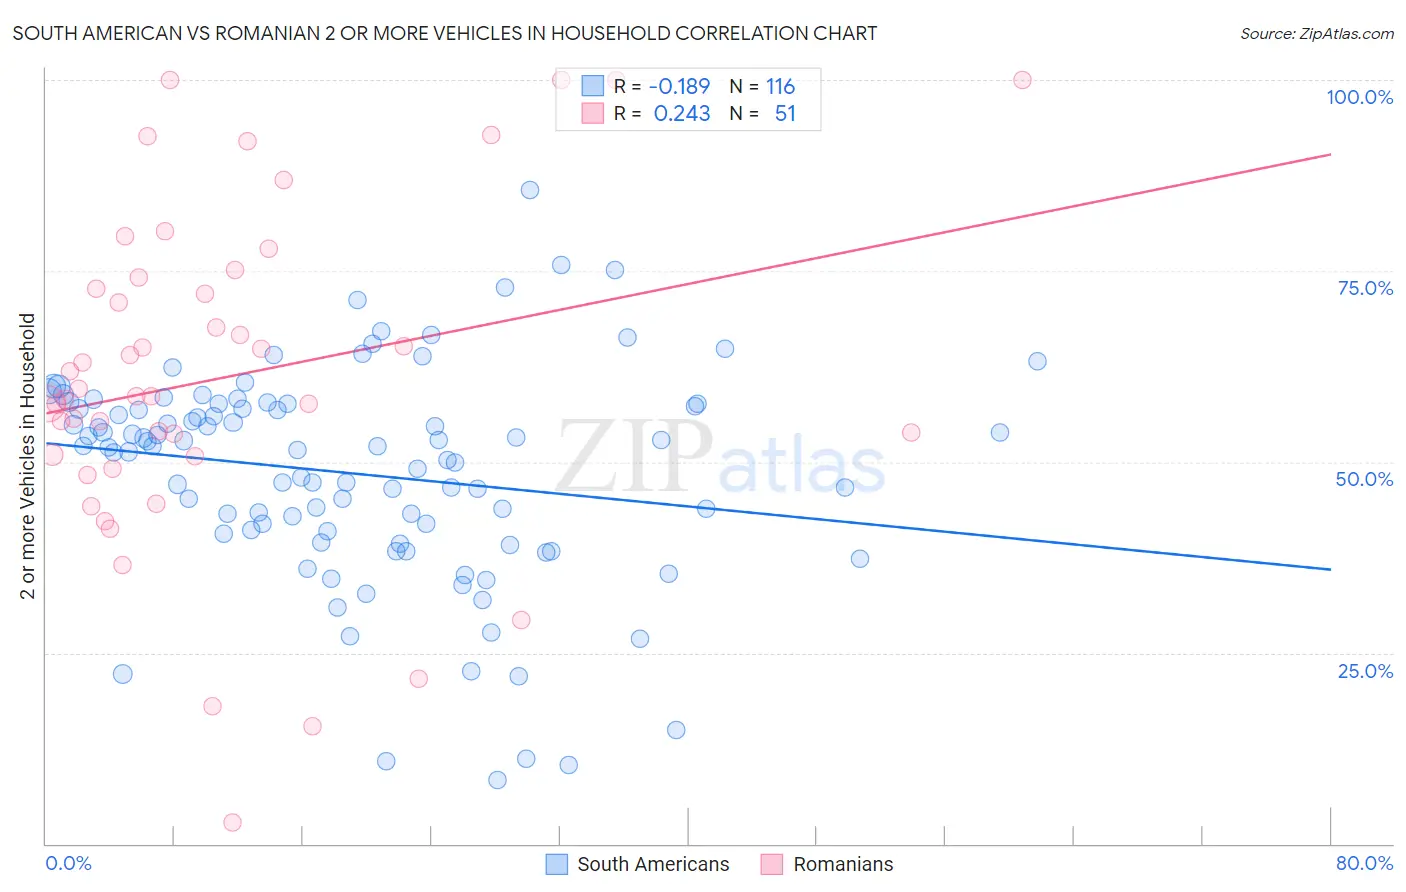
South American vs Romanian 2 or more Vehicles in Household Correlation Chart
The statistical analysis conducted on geographies consisting of 493,722,919 people shows a poor negative correlation between the proportion of South Americans and percentage of households with 2 or more vehicles available in the United States with a correlation coefficient (R) of -0.189 and weighted average of 51.9%. Similarly, the statistical analysis conducted on geographies consisting of 377,750,071 people shows a weak positive correlation between the proportion of Romanians and percentage of households with 2 or more vehicles available in the United States with a correlation coefficient (R) of 0.243 and weighted average of 55.5%, a difference of 6.9%.
2 or more Vehicles in Household Correlation Summary
| Measurement | South American | Romanian |
| Minimum | 8.3% | 2.7% |
| Maximum | 85.6% | 100.0% |
| Range | 77.2% | 97.3% |
| Mean | 48.5% | 61.1% |
| Median | 52.0% | 58.6% |
| Interquartile 25% (IQ1) | 40.8% | 50.7% |
| Interquartile 75% (IQ3) | 57.4% | 74.2% |
| Interquartile Range (IQR) | 16.7% | 23.5% |
| Standard Deviation (Sample) | 14.1% | 22.0% |
| Standard Deviation (Population) | 14.0% | 21.8% |
Similar Demographics by 2 or more Vehicles in Household
Demographics Similar to South Americans by 2 or more Vehicles in Household
In terms of 2 or more vehicles in household, the demographic groups most similar to South Americans are Subsaharan African (51.9%, a difference of 0.020%), Israeli (51.9%, a difference of 0.12%), African (51.8%, a difference of 0.16%), Immigrants from Ireland (52.0%, a difference of 0.17%), and Immigrants from Honduras (51.8%, a difference of 0.18%).
| Demographics | Rating | Rank | 2 or more Vehicles in Household |
| Immigrants | Latvia | 0.4 /100 | #264 | Tragic 52.2% |
| Immigrants | Congo | 0.3 /100 | #265 | Tragic 52.1% |
| Immigrants | France | 0.2 /100 | #266 | Tragic 52.0% |
| Immigrants | Colombia | 0.2 /100 | #267 | Tragic 52.0% |
| Pima | 0.2 /100 | #268 | Tragic 52.0% |
| Hondurans | 0.2 /100 | #269 | Tragic 52.0% |
| Immigrants | Ireland | 0.2 /100 | #270 | Tragic 52.0% |
| South Americans | 0.2 /100 | #271 | Tragic 51.9% |
| Sub-Saharan Africans | 0.2 /100 | #272 | Tragic 51.9% |
| Israelis | 0.2 /100 | #273 | Tragic 51.9% |
| Africans | 0.2 /100 | #274 | Tragic 51.8% |
| Immigrants | Honduras | 0.2 /100 | #275 | Tragic 51.8% |
| Immigrants | Croatia | 0.2 /100 | #276 | Tragic 51.8% |
| Immigrants | Africa | 0.2 /100 | #277 | Tragic 51.8% |
| Yuman | 0.1 /100 | #278 | Tragic 51.7% |
Demographics Similar to Romanians by 2 or more Vehicles in Household
In terms of 2 or more vehicles in household, the demographic groups most similar to Romanians are Immigrants from Austria (55.5%, a difference of 0.020%), French American Indian (55.5%, a difference of 0.030%), Immigrants from Costa Rica (55.4%, a difference of 0.060%), Kenyan (55.5%, a difference of 0.090%), and Immigrants from Sri Lanka (55.5%, a difference of 0.10%).
| Demographics | Rating | Rank | 2 or more Vehicles in Household |
| Immigrants | Zimbabwe | 60.2 /100 | #163 | Good 55.6% |
| Dutch West Indians | 59.8 /100 | #164 | Average 55.6% |
| Immigrants | El Salvador | 59.4 /100 | #165 | Average 55.6% |
| Immigrants | Sri Lanka | 58.3 /100 | #166 | Average 55.5% |
| Kenyans | 58.1 /100 | #167 | Average 55.5% |
| French American Indians | 56.7 /100 | #168 | Average 55.5% |
| Immigrants | Austria | 56.3 /100 | #169 | Average 55.5% |
| Romanians | 55.8 /100 | #170 | Average 55.5% |
| Immigrants | Costa Rica | 54.4 /100 | #171 | Average 55.4% |
| Immigrants | Nicaragua | 51.6 /100 | #172 | Average 55.4% |
| Immigrants | Western Europe | 51.4 /100 | #173 | Average 55.4% |
| Navajo | 50.0 /100 | #174 | Average 55.3% |
| Immigrants | Denmark | 49.4 /100 | #175 | Average 55.3% |
| Immigrants | Cuba | 47.0 /100 | #176 | Average 55.3% |
| Menominee | 46.2 /100 | #177 | Average 55.3% |